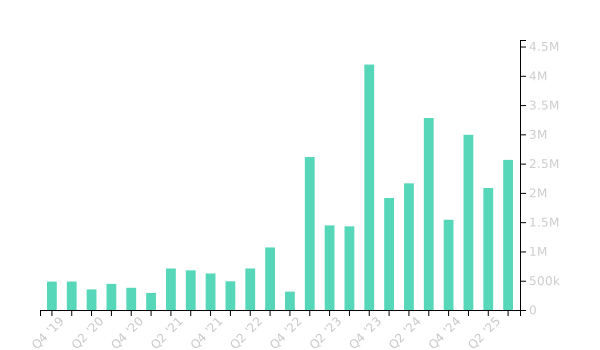
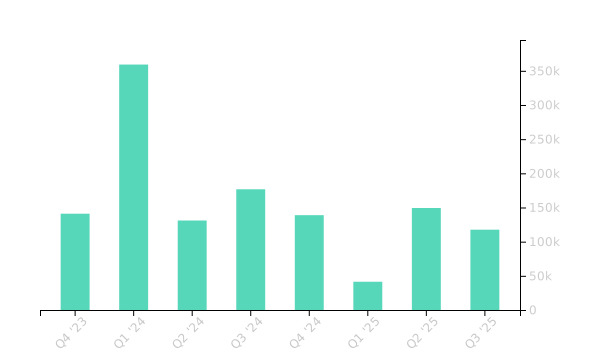
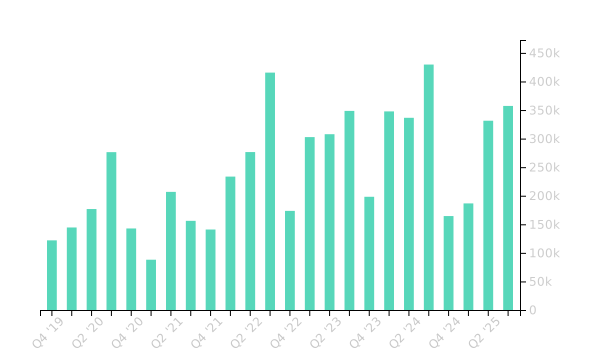
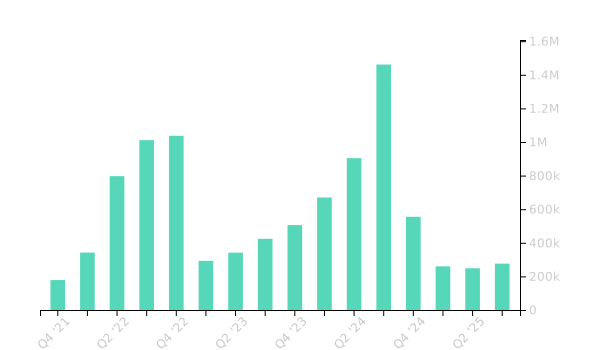
TAIPEI, Taiwan, Nov. 11, 2026 (GLOBE NEWSWIRE) -- Gogoro Inc. (“Gogoro,” “the Company” or “we”) (Nasdaq: GGR), a global technology leader in battery swapping ecosystems that enable sustainable mobility solutions for cities, today released its financial results for its third quarter ended September 30, 2026.
-
Gogoro achieved record-high quarterly gross margins in Q3 2026, with both IFRS and non-IFRS gross margins
1
reaching 24.4% compared with 12.2% and 22.2%, respectively, in Q3 2025. This reflects significant improvements in product economics and operational efficiency while mindful of inflationary pressures on raw material costs.
-
Operating cash flow increased 8.8% year-over-year to $27.9 million in the first nine months of 2026, marking six consecutive quarters of sustained operating cash generation and reinforcing Gogoro’s financial resilience.
Third Quarter 2026 Business Update and Outlook
-
A Challenging Electric-Powered Two-Wheeler (“ePTW”) Market
– Gogoro continued to strengthen its competitive position in the third quarter of 2026, supported by its ongoing product portfolio transformation. Gogoro Luna, which debuted in the previous quarter, successfully reached its target customer segment, while the EZZY series and Disney collaboration continued to broaden the Company’s product appeal. Gogoro remains firmly committed to advancing electric mobility. As the market leader with an established battery-swapping ecosystem, Gogoro is uniquely positioned to shape the future of electric two-wheel transportation. The Company remains focused on accelerating electric scooter adoption, strengthening its competitive leadership, and driving sustainable long-term growth.
-
Advanced Vietnam Market Expansion
– Gogoro continued to advance its international expansion strategy through Castrol Gogoro Mobility (“CGM”), its joint venture with Castrol. Vietnam represents a significant strategic opportunity, with approximately 80 million registered powered two-wheelers and a registered fleet that continues to expand. Vietnam’s electric two-wheeler market demonstrates strong growth potential. Electric two-wheeler sales reached approximately 735,000 units in full-year 2025, which is more than 20% of total two-wheeler sales. In the first nine months of 2026 alone, sales already surpassed the full-year 2025 total. As the transition toward electric mobility accelerates, CGM established its presence in Vietnam during the third quarter and expanded its battery-swapping infrastructure in Ho Chi Minh City, laying the foundation to capture future growth and support the broader adoption of electric two-wheelers.
-
Established Strategic Partnerships with Two of the Leading Delivery Service Platforms in Vietnam
– The collaboration aims to evaluate the operational efficiency and feasibility of battery swapping for commercial riders with high daily vehicle utilization, while gathering valuable insights to support future expansion of the battery-swapping ecosystem in Vietnam. The Vietnam pilot is showing promising results, with participating commercial riders traveling approximately 150–160 kilometers. This high level of vehicle utilization demonstrates the suitability of Gogoro’s battery-swapping technology for demanding commercial applications and reinforces our confidence in the long-term potential of Vietnam’s commercial electric mobility market.
_______________________________
1
This is a non-IFRS measure. See
Use of Non-IFRS Financial Measures
for a description of the non-IFRS measures and
Reconciliation of IFRS Financial Metrics to Non-IFRS
for a reconciliation of the Company’s non-IFRS financial measures to their most directly comparable IFRS measures.
Third Quarter 2026 Financial Summary
-
Revenue of $70.6 million, down 9.1% year-over-year and down 2.9% on a constant currency basis
1
.
-
Battery swapping service revenue of $37.1 million, down 4.7% year-over-year and up 1.8% on a constant currency basis
1
.
-
Revenue from sales of hardware and others of $33.5 million, down 13.5% year-over-year and down 7.5% on a constant currency basis
1
.
-
Gross margin of 24.4%, up from 12.2% in the same period last year. Non-IFRS gross margin
1
of 24.4%, up from 22.2% year-over-year.
-
Net loss decreased to $3.4 million from $14.9 million in the same period last year.
-
Adjusted EBITDA
1
of $19.0 million, down from $20.2 million in the same period last year.
“As we move through 2026, Gogoro is reaffirming its market leadership through decisive product innovation and disciplined execution. Our product transformation strategy is delivering encouraging results, with our refreshed product portfolio successfully reaching our intended customer segments during the third quarter. These achievements reinforce our competitive position and demonstrate our ability to respond to evolving market needs while strengthening our operational efficiency and financial performance. We remain focused on building on this momentum and creating a stronger foundation for sustainable, long-term growth,”
said Henry Chiang, CEO of Gogoro.
“Beyond our established markets, we are encouraged by the progress of our Vietnam pilot program and the positive momentum from our local partnerships. Vietnam represents an exciting long-term opportunity for Gogoro, with significant potential to bring our battery-swapping ecosystem and electric mobility solutions to a broader market. We believe that our continued investment in product innovation, operational excellence, and carefully selected international opportunities can strengthen our foundation and create lasting value for the Company.”
“While year-over-year revenue declined amid challenging market conditions, we have maintained a disciplined approach to commercial growth, prioritizing healthier product economics and sustainable revenue quality over short-term volume gains driven by aggressive marketing spending. At the same time, we are making progress in improving operating efficiency and resource allocation, with a continued focus on translating these improvements into stronger financial performance and long-term business sustainability,”
said Jacky Lee, Principal Financial Officer (
“
PFO
”
) of Gogoro
. “Looking ahead, we are encouraged by the healthy operating momentum and increasingly predictable financial contribution of our core battery-swapping business. We believe this positions Gogoro to pursue future growth opportunities through disciplined capital allocation, continued development of our battery-swapping ecosystem, and selective expansion into international markets. Our focus remains on building a scalable business model that can generate sustainable financial returns and create lasting shareholder value.”
Third Quarter 2026 Financial Overview
Operating Revenues
For the third quarter, total revenue was $70.6 million, down 9.1% year-over-year and down 2.9% on a constant currency basis
1
. Had foreign exchange rates remained constant with the average rate of the same period last year, revenue would have been $4.8 million higher.
-
Battery swapping service revenue for the third quarter was $37.1 million, down 4.7% year-over-year, and up 1.8% on a constant currency basis
1
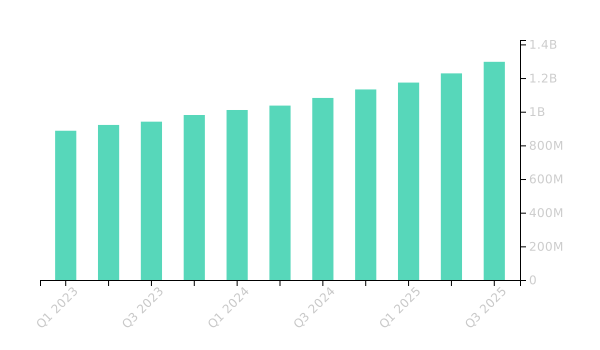
. Total subscribers reached 684,000 at the end of the third quarter, representing a 4% year-over-year increase from 657,000 at the end of the same quarter last year. On a constant currency basis, battery swapping service revenue expanded year-over-year, driven primarily by subscriber growth and resilient customer retention. While a higher mix of low-mileage subscribers slightly tempered average revenue per user (“ARPU”), our expanding user base continues to support the resilience of our subscription revenue model. Furthermore, our subscription model continues to optimize network utilization and operational efficiency, strengthening the long-term unit economics of our platform.
-
Revenue from sales of hardware and others for the third quarter was $33.5 million, down 13.5% year-over-year, and down 7.5% on a constant currency basis
1
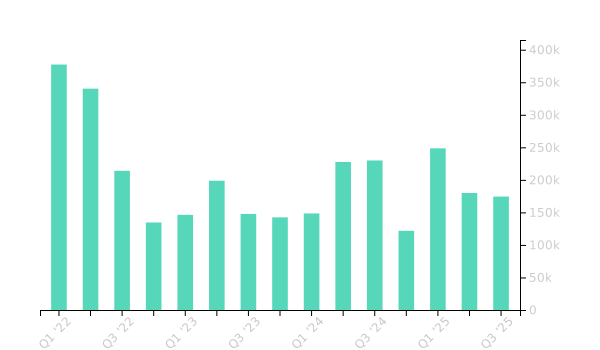
. The year-over-year decrease in revenue from sales of hardware and others was primarily driven by (i) a 9.7% year-over-year decline in Gogoro-branded & Powered by Gogoro Network (“PBGN”) scooter registrations, (ii) lower component and accessory sales to international customers and PBGN partners, and (iii) a drop in sharing revenue stemming from lower utilization of shared e-scooters. The decrease in sales revenue was partially offset by a higher average selling price (“ASP”), resulting from a product mix shift toward higher-end models, including the Gogoro Luna launched in late Q2 2026, compared to the same period last year.
Gross Margin
For the third quarter, gross margin was 24.4%, up from 12.2% in the same period last year, while non-IFRS gross margin
1
was 24.4%, up from 22.2% in the same period last year. This substantial margin expansion was primarily by the following factors: (i) a $7.7 million reduction in costs associated with battery upgrade initiatives following the program’s completion at the end of the prior year; (ii) improved overhead absorption, as higher production volumes reduced excess capacity costs; (iii) broader energy network savings, where enhanced network efficiency, extended battery lifespans from prior upgrades, and disciplined operational management collectively lowered depreciation, operation and maintenance (“O&M”); and (iv) an increase in ASP, resulting from a product mix shift toward higher-end models following the launch of Gogoro Luna in late Q2 2026, compared to entry-level models in the same period last year.
Over the past two years, we have undertaken a program to carry out one-time, voluntary upgrades on certain battery packs, which was completed in the fourth quarter of 2025. These upgrades provide multiple benefits — enabling a more efficient deployment of our resources than replacing battery packs, increasing each battery pack’s lifetime capacity, including extending its use in second-life mobility applications, and providing additional evidence supporting our second-life thesis. These upgrades are generating and expected to generate economic benefits in the long run; the upgrades had reduced our gross margin in prior years.
Net Loss
For the third quarter, net loss was $3.4 million, representing a decrease of $11.5 million from a net loss of $14.9 million in the same period last year. The decrease in net loss was primarily driven by a $7.7 million increase in gross profit, mainly due to a $7.7 million decrease in costs associated with battery upgrade initiatives, a favorable product mix and network-wide operational efficiencies. Additionally, operating expenses contracted by $3.0 million, reflecting lower personnel-related expenses resulting from improved organizational efficiency, as well as reduced share-based compensation. Non-IFRS net loss
1
narrowed to $3.9 million from $6.7 million, primarily reflecting a $3.4 million favorable impact from changes in accounting estimates. We expect our quarterly net loss to remain impacted by a challenging revenue outlook, while increased investments in brand marketing, channel development and Vietnam expansion are expected to moderate further quarter-over-quarter profitability improvement.
Adjusted EBITDA
For the third quarter, Adjusted EBITDA
1
was $19.0 million, representing a slight decrease of $1.2 million from $20.2 million in the same period last year. The decrease was primarily attributable to a $3.2 million reduction in non-IFRS gross profit
1
(excluding depreciation and amortization). The decrease was partially offset by a $2.1 million reduction in operating expenses (excluding share-based compensation and depreciation and amortization) resulting from various cost-saving initiatives.
Liquidity
For the nine months ended September 30, 2026, operating cash inflows increased 8.8% to $27.9 million, compared with $25.7 million in the same period last year, reflecting continued benefits from organizational restructuring, improved operating efficiency, and disciplined working capital management. Our liquidity position is supported by disciplined capital allocation, operating cash flows, reduced capital expenditures following the completion of battery upgrade initiatives in Q4 2025, and the continued reduction of outstanding debt. As of September 30, 2026, we had cash and cash equivalents of $68.9 million, including the $16.7 million investment from Gold Sino. This investment was made pursuant to the equity funding commitment of up to NT$2.5 billion, previously secured by a director of Gogoro. In October 2026, we received an additional $61.8 million in equity proceeds from the second and final round of funding under this commitment. The additional capital further strengthens our liquidity position and provides additional financial flexibility to support our strategic priorities and future growth.
Updated 2026 Guidance
Given the continued challenging market conditions, we have revised our full-year 2026 revenue guidance and now expect revenue to range between $270 million and $290 million, with approximately 95% expected to come from the Taiwan market. Despite these near-term market challenges, we expect to achieve free cash flow in 2027 and profitability in 2028.
Conference Call Information
Gogoro’s management team will hold an earnings webcast on November 11, 2026, at 7:00 a.m. Eastern Time to discuss the Company’s third quarter 2026 results of operations and outlook.
Investors may access the webcast, supplemental financial information and investor presentation at Gogoro’s investor relations website (
https://investor.gogoro.com
) under the “Events” section. A replay of the investor presentation and the earnings call script will be available 24 hours after the conclusion of the webcast and archived for one year.
About Gogoro
Founded in 2011 to rethink urban energy, Gogoro is the world’s leader in battery-swapping electric mobility, setting new standards for sustainable mobility. Powering nearly 700,000 riders and over 900 million battery swaps across more than 2,700 GoStation locations, the Gogoro Network redefines how cities move. Recognized globally in 2024, including Fortune’s “Change the World,” Fast Company’s “Asia-Pacific’s Most Innovative Company,” MIT Technology Review’s “15 Climate Tech Companies to Watch,” and Frost & Sullivan’s “Global Company of the Year” for battery swapping, Gogoro continues to disrupt the status quo, accelerate the shift to cleaner and smarter mobility, and reimagine how cities move.
Forward-Looking Statements
This communication contains forward-looking statements within the meaning of Section 27A of the Securities Act of 1933, as amended, and Section 21E of the Securities Exchange Act of 1934, as amended. Forward-looking statements generally relate to future events or Gogoro's future financial or operating performance. In some cases, you can identify forward-looking statements because they contain words such as "may," "will," "should," "expects," "plans," "anticipates," "going to," "could," "intends," "target," "projects," "contemplates," "believes," "estimates," "predicts," "potential" or "continue" or the negative of these words or other similar terms or expressions that concern Gogoro's expectations, strategy, priorities, plans or intentions. Forward-looking statements in this communication include, but are not limited to, statements in the section entitled, "Updated 2026 Guidance," such as estimates regarding Gogoro's revenue in 2026 and Gogoro's ability to achieve profitability and free cash flow; Gogoro's ability to build a scalable business model that can generate sustainable financial returns and create lasting shareholder value; Gogoro's future plans and growth strategy; Gogoro's plans for, and the anticipated results of, its expansion in Vietnam; Gogoro's market opportunity in Vietnam; Gogoro's future product strategy and Gogoro's ability to innovate; Gogoro's ability to execute on its strategy; Gogoro's expectations regarding its market share; statements regarding market trends; and statements by Gogoro's chief executive officer and principal financial officer. Gogoro’s expectations and beliefs regarding these matters may not materialize, and actual results in future periods are subject to risks and uncertainties that could cause actual results to differ materially from those projected, including risks related to Gogoro incurring operating losses historically and expecting to incur significant expenses and continuing losses; Gogoro's cash position, dependence on a director associated with its largest shareholder to procure equity financing and ability to raise additional funds; Gogoro's indebtedness, including its ability to repay, refinance or extend its borrowings and other financial obligations as they come due; future operating and financial results being subject to significant uncertainty; Gogoro's ability to achieve its revised 2026 revenue guidance, including in light of continued softness in demand in Taiwan; Gogoro's ability to achieve its non-IFRS profitability and free cash flow targets for the Gogoro Network and hardware businesses on the anticipated timelines, or at all; Gogoro's ability to grow and retain its subscriber base; Gogoro's ability to realize anticipated cost savings and efficiencies from its organizational restructuring and network optimization initiatives; Gogoro not being able to achieve market share; Gogoro not being able to execute on its strategy; challenges associated with strategic collaborations or alliances; risks related to Gogoro's expansion in Vietnam through CGM, including risks related to Gogoro's partnerships; Gogoro's failure to execute its growth strategy or manage growth effectively; Gogoro's failure to develop new products or technologies; Gogoro's failure to manage its supply chain; delays in launching the production of Gogoro's products and features; the cost, timing and results of Gogoro's planned capital expenditures and network upgrades, including the retirement of first-generation batteries and the deployment of GoStation Q; the performance and useful lives of Gogoro's battery packs, including upgraded battery packs, and the realization of the anticipated benefits of the battery upgrade program; Gogoro's exposure to fluctuations in currency exchange rates; Gogoro facing strong competition; changes to fuel economy standards or the success of alternative fuels; Gogoro's dependence on the rapid adoption of and demand for ePTWs and battery swapping services; changes in government policies, incentives and regulations affecting ePTWs and battery swapping in Taiwan, Vietnam and other markets; rapid technological change in the ePTW market; the timely release of new products by Gogoro; market acceptance of Gogoro's new products, including Gogoro Luna and the EZZY series; Gogoro's ability to protect its technology and intellectual property; risks related to maintaining and expanding Gogoro's international operations; macroeconomic factors including inflation and consumer confidence; and risks related to the Taiwan scooter market. The forward-looking statements contained in this communication are also subject to other risks and uncertainties, including those more fully described in Gogoro's filings with the Securities and Exchange Commission (“SEC”), including in Gogoro’s Form 20-F for the year ended December 31, 2025, which was filed on March 31, 2026 and in its subsequent filings with the SEC, copies of which are available on the SEC's website at
www.sec.gov
. The forward-looking statements in this communication are based on information available to Gogoro as of the date hereof, and Gogoro disclaims any obligation to update any forward-looking statements, except as required by law.
Condensed Consolidated Financial Statements
The condensed consolidated financial statements are unaudited and have been prepared in accordance with the International Financial Reporting Standards (collectively, “IFRS”) issued by the International Accounting Standards Board and regulations of the U.S. Securities and Exchange Commission (“SEC”) for interim financial reporting. The Company’s condensed consolidated financial statements reflect all normal adjustments that are, in our opinion, necessary to provide a fair statement of results for the interim periods and the years presented, including the accounts of the Company and entities controlled by Gogoro Inc. The audited consolidated financial statements may differ materially from the unaudited condensed consolidated financial statements. Our audited financial statements for the full year ending December 31, 2026 will be included in the Company’s Annual Report on Form 20-F for the year ending December 31, 2026. Accordingly, these condensed consolidated financial statements should be read in conjunction with the audited consolidated financial statements and related notes for the year ended December 31, 2025 included in the Company’s Annual Report on Form 20-F filed with the SEC on March 31, 2026, which provides a more complete discussion of the Company’s accounting policies and certain other information. The condensed consolidated financial statements may include selected updates, notes and disclosures if there are significant changes since the date of the most recent annual report on Form 20-F which included the audited financial statements of the Company.
Use of Non-IFRS Financial Measures
This press release and accompanying tables contain certain non-IFRS financial measures as listed below.
Foreign Exchange (“FX”) Effect on Operating Revenues.
We compare the dollar amount and the percent change in the operating revenues from the current period to the same period last year using constant currency disclosure. We present constant currency information to provide a framework for assessing how our underlying revenues performed excluding the effect of foreign currency rate fluctuations. To present this information, current period operating revenues for entities reporting in currencies other than USD are converted into USD at the average exchange rates from the equivalent periods last year.
Non-IFRS
Gross Profit and Gross Margin.
Gogoro defines non-IFRS gross profit and gross margin as gross profit and gross margin excluding share-based compensation and battery upgrade initiatives.
Non-IFRS Net Loss.
Gogoro defines non-IFRS net loss as net loss excluding share-based compensation, the change in fair value of financial liabilities, battery upgrade initiatives and impairment charges. These amounts do not reflect the impact of any related tax effects.
EBITDA.
Gogoro defines EBITDA as net loss excluding interest expense, net, provision for income tax (if any), depreciation, and amortization. These amounts do not reflect the impact of any related tax effects.
Adjusted EBITDA.
Gogoro defines Adjusted EBITDA as EBITDA excluding share-based compensation, the change in fair value of financial liabilities, battery upgrade initiatives and impairment charges. These amounts do not reflect the impact of any related tax effects.
Free Cash Flow.
Gogoro defines Free Cash Flow as net cash flows from operating activities less capital expenditures.
Share-based Compensation.
Share-based compensation consists of non-cash charges related to the fair value of restricted stock units awarded to employees and stock options granted to certain directors, executives, employees and others providing similar services. We believe that the exclusion of these non-cash charges provides for more accurate comparisons of our operating results to our peer companies due to the varying available valuation methodologies, subjective assumptions and the variety of award types. In addition, we believe it is useful for investors to understand the specific impact of share-based compensation on our operating results.
Change in Fair Value of Financial Liabilities.
These are non-cash mark-to-market adjustments associated with earnout shares, earn-in shares, and warrants associated with the de-SPAC in 2022. We exclude these items for purposes of calculating certain non-IFRS measures because these are driven primarily by changes in market valuation assumptions and the Company’s share price rather than our underlying operating performance. We believe that this exclusion enhances the comparability of our period-to-period operating results with those of our peers.
Battery Upgrade Initiatives.
As we performed certain voluntary upgrades to our battery packs, this charge represented the (i) derecognition expense on components removed from the battery pack that were not expected to generate any future benefits upon their disposal and (ii) battery pack retrieval and other directly attributable costs incurred during the battery upgrades. We only upgraded battery packs in instances where the value created exceeds the cost of the upgrade. The program improves batteries’ capacity and extends the remaining useful life of certain battery packs. The derecognition expense and the retrieval and other costs were recorded under Cost of Revenues in the Condensed Consolidated Statements of Comprehensive Loss. We exclude such expenditures for purposes of calculating certain non-IFRS measures because these charges do not reflect how management evaluates our operating performance and may not be indicative of our core business operating results. The adjustments facilitate a useful evaluation of our operating performance and comparisons to past operating results and provide investors with additional means to evaluate our profitability trends. The battery upgrade initiatives were completed in Q4 2025.
Impairment charges.
These consist of non-cash impairment charges, primarily associated with adjustments to the carrying values of certain machinery and equipment which is currently underutilized. The process of evaluating the potential impairment of long-lived assets under the accounting guidance on property, plant and equipment is subjective and requires judgment. We exclude impairment charges for purposes of calculating certain non-IFRS measures because the charges do not reflect our core operating performance. These adjustments facilitate a useful evaluation of our core operating performance and comparisons to past operating results and provide investors with additional means to evaluate expense trends.
These non-IFRS financial measures exclude, as applicable, the effect of foreign currency exchange rate fluctuations, interest expense, provision for income tax (if any), depreciation and amortization, share-based compensation, change in fair value of financial liabilities, impairment charges and battery upgrade initiatives. The Company uses these non-IFRS financial measures internally in analyzing its financial results and believes that these non-IFRS financial measures are useful to investors as an additional tool to evaluate ongoing operating results and trends. In addition, these measures are the primary indicators management uses as a basis for its planning and forecasting for future periods.
Non-IFRS financial measures are not meant to be considered in isolation or as a substitute for comparable IFRS financial measures. Non-IFRS financial measures are subject to limitations and should be read only in conjunction with the Company’s condensed consolidated financial statements prepared in accordance with IFRS. Non-IFRS financial measures do not have any standardized meaning and are therefore unlikely to be comparable to similarly titled measures presented by other companies. Descriptions of these non-IFRS financial measures have been provided above, and reconciliations of the Company’s non-IFRS financial measures to their most directly comparable IFRS measures have been provided in the financial statement tables included in this press release, and investors are encouraged to review these reconciliations. Gogoro has not reconciled its forward-looking non-IFRS targets to the most directly comparable IFRS measures because it cannot do so without unreasonable efforts, given the inherent difficulty of forecasting the timing and amount of the items that would be excluded, such as capital expenditures for free cash flow; share-based compensation and fair value changes for non-IFRS profitability. These items could be significant to the comparable IFRS measures.
GOGORO INC.
Condensed Consolidated Balance Sheets
(unaudited)
(in thousands of U.S. dollars)
|
|
|
|
|
|
|
|
|
|
September 30,
|
|
December 31,
|
|
|
2026
|
|
2025
|
|
ASSETS
|
|
|
|
|
Current assets:
|
|
|
|
|
Cash and cash equivalents
|
$
|
68,941
|
|
$
|
70,574
|
|
Trade receivables
|
|
18,852
|
|
|
18,688
|
|
Inventories
2
|
|
35,010
|
|
|
28,876
|
|
Other assets, current
3
|
|
15,921
|
|
|
12,762
|
|
Total current assets
|
|
138,724
|
|
|
130,900
|
|
|
|
|
|
|
Property, plant and equipment
2
|
|
389,041
|
|
|
419,965
|
|
Right-of-use assets
|
|
22,669
|
|
|
26,903
|
|
Investments accounted for using equity method
|
|
15,577
|
|
|
16,379
|
|
Other assets, non-current
|
|
7,611
|
|
|
7,422
|
|
Total assets
|
$
|
573,622
|
|
$
|
601,569
|
|
|
|
|
|
|
LIABILITIES AND EQUITY
|
|
|
|
|
Current liabilities:
|
|
|
|
|
Borrowings, current
|
$
|
92,309
|
|
$
|
83,361
|
|
Financial liabilities at fair value through profit or loss
|
|
75
|
|
|
264
|
|
Notes and trade payables
|
|
13,007
|
|
|
12,691
|
|
Contract liabilities, current
|
|
9,100
|
|
|
9,766
|
|
Lease liabilities, current
|
|
10,378
|
|
|
10,025
|
|
Financial liabilities at amortized cost, current
4
|
|
25,000
|
|
|
10,000
|
|
Provisions, current
|
|
4,530
|
|
|
4,306
|
|
Other liabilities, current
|
|
46,426
|
|
|
41,524
|
|
Total current liabilities
|
|
200,825
|
|
|
171,937
|
|
|
|
|
|
|
Borrowings, non-current
|
|
245,227
|
|
|
277,596
|
|
Lease liabilities, non-current
|
|
12,166
|
|
|
17,283
|
|
Financial liabilities at amortized cost, non-current
4
|
|
—
|
|
|
15,000
|
|
Provisions, non-current
|
|
804
|
|
|
951
|
|
Other liabilities, non-current
|
|
6,619
|
|
|
10,562
|
|
Total liabilities
|
|
465,641
|
|
|
493,329
|
|
|
|
|
|
|
Total equity
|
|
107,981
|
|
|
108,240
|
|
Total liabilities and equity
|
$
|
573,622
|
|
$
|
601,569
|
|
|
September 30,
|
|
December 31,
|
|
|
2026
|
|
2025
|
|
Inventories:
|
|
|
|
|
Raw materials
|
$
|
15,336
|
|
$
|
14,670
|
|
Semi-finished goods
|
|
2,572
|
|
|
1,545
|
|
Merchandise
|
|
17,102
|
|
|
12,661
|
|
Total inventories
|
$
|
35,010
|
|
$
|
28,876
|
|
|
|
|
|
|
|
_______________________________
2
Based on the deployment plan for the next 12 months, the Company classified $13.0 million and $20.0 million of undeployed battery packs and related battery cells from inventory to property, plant and equipment as of September 30, 2026 and December 31, 2025, respectively.
3
In March 2026, the Company and Castrol Holdings International Limited (“Castrol”) each contributed $2.1 million to Castrol Gogoro Mobility Joint Stock Company (“CGM”) pursuant to a shareholder loan agreement. Since the principal portion of the loan is convertible into equity of CGM when certain criteria are met, the Company classified the loan as financial assets at fair value through profit or loss in accordance with IFRS 9.
4
The $15.0 million put options previously classified under non-current financial liabilities at amortized cost have been reclassified to current financial liabilities, as the Company does not have an unconditional right to defer settlement for at least 12 months after the reporting date.
GOGORO INC.
Condensed Consolidated Statements of Comprehensive Loss
(
unaudited)
(in thousands of U.S. dollars, except net loss per share)
|
|
|
|
|
|
|
|
|
|
|
|
|
|
|
|
|
|
|
|
Three Months Ended September 30,
|
|
Nine Months Ended September 30,
|
|
|
2026
|
|
2025
|
|
2026
|
|
2025
|
|
Operating revenues
|
$
|
70,599
|
|
|
$
|
77,647
|
|
|
$
|
204,133
|
|
|
$
|
207,081
|
|
|
Cost of revenues
|
|
53,371
|
|
|
|
68,155
|
|
|
|
158,117
|
|
|
|
194,261
|
|
|
Gross profit
|
|
17,228
|
|
|
|
9,492
|
|
|
|
46,016
|
|
|
|
12,820
|
|
|
Operating expenses:
|
|
|
|
|
|
|
|
|
Sales and marketing
|
|
8,180
|
|
|
|
8,901
|
|
|
|
22,691
|
|
|
|
24,388
|
|
|
General and administrative
|
|
5,567
|
|
|
|
6,787
|
|
|
|
16,053
|
|
|
|
20,767
|
|
|
Research and development
|
|
5,951
|
|
|
|
6,312
|
|
|
|
18,161
|
|
|
|
18,697
|
|
|
Other operating (income) expense
|
|
288
|
|
|
|
981
|
|
|
|
(155
|
)
|
|
|
3,035
|
|
|
Total operating expenses
|
|
19,986
|
|
|
|
22,981
|
|
|
|
56,750
|
|
|
|
66,887
|
|
|
Loss from operations
|
|
(2,758
|
)
|
|
|
(13,489
|
)
|
|
|
(10,734
|
)
|
|
|
(54,067
|
)
|
|
Non-operating income and expenses:
|
|
|
|
|
|
|
|
|
Interest expense, net
|
|
(2,903
|
)
|
|
|
(3,568
|
)
|
|
|
(8,896
|
)
|
|
|
(9,635
|
)
|
|
Other income, net
|
|
1,996
|
|
|
|
2,299
|
|
|
|
4,460
|
|
|
|
3,722
|
|
|
Change in fair value of financial liabilities
|
|
204
|
|
|
|
8
|
|
|
|
189
|
|
|
|
1,843
|
|
|
Share of loss of investments accounted for using equity method
|
|
98
|
|
|
|
(192
|
)
|
|
|
(1,150
|
)
|
|
|
(1,894
|
)
|
|
Total non-operating expense
|
|
(605
|
)
|
|
|
(1,453
|
)
|
|
|
(5,397
|
)
|
|
|
(5,964
|
)
|
|
Net loss
|
|
(3,363
|
)
|
|
|
(14,942
|
)
|
|
|
(16,131
|
)
|
|
|
(60,031
|
)
|
|
Other comprehensive loss:
|
|
|
|
|
|
|
|
|
Exchange differences on translation
|
|
(627
|
)
|
|
|
(5,187
|
)
|
|
|
(874
|
)
|
|
|
11,785
|
|
|
Total comprehensive loss
|
$
|
(3,990
|
)
|
|
$
|
(20,129
|
)
|
|
$
|
(17,005
|
)
|
|
$
|
(48,246
|
)
|
|
|
|
|
|
|
|
|
|
|
Basic and diluted net loss per share
5
|
$
|
(0.17
|
)
|
|
$
|
(1.01
|
)
|
|
$
|
(0.86
|
)
|
|
$
|
(4.07
|
)
|
|
Shares used in computing basic and diluted net loss per share
5
|
|
20,074
|
|
|
|
14,759
|
|
|
|
18,676
|
|
|
|
14,748
|
|
|
|
|
|
|
|
|
|
|
|
|
Three Months Ended September 30,
|
|
Nine Months Ended September 30,
|
|
Operating revenues:
|
2026
|
|
2025
|
|
2026
|
|
2025
|
|
Sales of hardware and others
|
$
|
33,524
|
|
|
$
|
38,735
|
|
|
$
|
93,046
|
|
|
$
|
96,073
|
|
|
Battery swapping service
|
|
37,075
|
|
|
|
38,912
|
|
|
|
111,087
|
|
|
|
111,008
|
|
|
Total
|
$
|
70,599
|
|
|
$
|
77,647
|
|
|
$
|
204,133
|
|
|
$
|
207,081
|
|
|
|
|
|
|
|
|
|
|
|
|
Three Months Ended September 30,
|
|
Nine Months Ended September 30,
|
|
Share-based compensation:
|
2026
|
|
2025
|
|
2026
|
|
2025
|
|
Cost of revenues
|
$
|
(36
|
)
|
|
$
|
67
|
|
|
$
|
36
|
|
|
$
|
227
|
|
|
Sales and marketing
|
|
(36
|
)
|
|
|
56
|
|
|
|
28
|
|
|
|
335
|
|
|
General and administrative
|
|
(167
|
)
|
|
|
281
|
|
|
|
(56
|
)
|
|
|
1,096
|
|
|
Research and development
|
|
(115
|
)
|
|
|
155
|
|
|
|
42
|
|
|
|
670
|
|
|
Total
|
$
|
(354
|
)
|
|
$
|
559
|
|
|
$
|
50
|
|
|
$
|
2,328
|
|
|
|
|
|
|
|
|
|
|
|
|
|
|
|
|
|
|
_______________________________
5
On October 6, 2025, the Company effected a 1-for-20 share consolidation (reverse stock split) of its ordinary shares. The shares used in computing basic and diluted net loss per share for the three months and nine months ended September 30, 2025 have been retrospectively adjusted in accordance with IAS 33 Earnings per Share.
GOGORO INC.
Condensed Consolidated Statements of Cash Flows
(unaudited)
(in thousands of U.S. dollars)
|
|
|
|
|
|
|
|
Nine Months Ended September 30,
|
|
|
2026
|
|
2025
|
|
Operating activities
|
|
|
|
|
Net loss
|
$
|
(16,131
|
)
|
|
$
|
(60,031
|
)
|
|
Adjustments for:
|
|
|
|
|
Depreciation and amortization
|
|
61,962
|
|
|
|
68,528
|
|
|
Recognition of inventory write-down (reversal)
|
|
640
|
|
|
|
(2,246
|
)
|
|
Impairment losses recognized associated with facilities and receivables
|
|
494
|
|
|
|
2,025
|
|
|
Share of loss of investments accounted for using equity method
|
|
1,150
|
|
|
|
1,894
|
|
|
Change in fair value of financial liabilities
|
|
(189
|
)
|
|
|
(1,843
|
)
|
|
Interest expense, net
|
|
8,896
|
|
|
|
9,635
|
|
|
Share-based compensation
|
|
50
|
|
|
|
2,328
|
|
|
Loss on disposal of property and equipment and right-of-use assets, net
|
|
2,197
|
|
|
|
12,816
|
|
|
Recognition of provisions
|
|
1,905
|
|
|
|
1,033
|
|
|
Changes in operating assets and liabilities:
|
|
|
|
|
Trade receivables
|
|
(716
|
)
|
|
|
(4,052
|
)
|
|
Inventories
|
|
(14,257
|
)
|
|
|
12,333
|
|
|
Other current assets
|
|
(964
|
)
|
|
|
92
|
|
|
Notes and trade payables
|
|
316
|
|
|
|
(8,849
|
)
|
|
Contract liabilities
|
|
(1,451
|
)
|
|
|
(27
|
)
|
|
Other liabilities
|
|
(6,008
|
)
|
|
|
2,484
|
|
|
Provisions
|
|
(1,439
|
)
|
|
|
(1,647
|
)
|
|
Cash generated from operations
|
|
36,455
|
|
|
|
34,473
|
|
|
Interest expense paid, net
|
|
(8,542
|
)
|
|
|
(8,811
|
)
|
|
Net cash generated from operating activities
|
|
27,913
|
|
|
|
25,662
|
|
|
Investing activities
|
|
|
|
|
Payments for property, plant and equipment, net
|
|
(22,516
|
)
|
|
|
(51,461
|
)
|
|
Decrease in refundable deposits
|
|
407
|
|
|
|
38
|
|
|
Payments of intangible assets, net
|
|
(234
|
)
|
|
|
(109
|
)
|
|
Shareholder loan advanced to joint venture
6
|
|
(2,100
|
)
|
|
|
—
|
|
|
Proceeds from disposal of subsidiary
|
|
116
|
|
|
|
—
|
|
|
Payments for acquisition of investment accounted for using equity method
|
|
—
|
|
|
|
(1,000
|
)
|
|
Decrease in other financial assets
|
|
122
|
|
|
|
2,644
|
|
|
Net cash used in investing activities
|
|
(24,205
|
)
|
|
|
(49,888
|
)
|
|
Financing activities
|
|
|
|
|
Proceeds from borrowings
|
|
6,274
|
|
|
|
78,425
|
|
|
Repayments of borrowings
|
|
(25,384
|
)
|
|
|
(44,525
|
)
|
|
Proceeds from issuance of shares
7,8
|
|
16,695
|
|
|
|
—
|
|
|
Guarantee deposits (refund) received
|
|
(183
|
)
|
|
|
47
|
|
|
Repayment of the principal portion of lease liabilities
|
|
(8,939
|
)
|
|
|
(9,786
|
)
|
|
Net cash (used in) generated from financing activities
|
|
(11,537
|
)
|
|
|
24,161
|
|
|
Effect of exchange rate changes on cash and cash equivalents
|
|
6,196
|
|
|
|
2,404
|
|
|
Net (decrease) increase in cash and cash equivalents
|
|
(1,633
|
)
|
|
|
2,339
|
|
|
Cash and cash equivalents at the beginning of the period
|
|
70,574
|
|
|
|
117,148
|
|
|
Cash and cash equivalents at the end of the period
|
$
|
68,941
|
|
|
$
|
119,487
|
|
|
|
|
|
|
|
|
|
|
_______________________________
6
In March 2026, the Company and Castrol each contributed $2.1 million to CGM pursuant to a shareholder loan agreement. Since the principal portion of the loan is convertible into equity of CGM upon satisfaction of certain criteria, the Company has classified the loan as financial assets at fair value through profit or loss in accordance with IFRS 9. In October 2026, the Company and Castrol each contributed an additional $3.0 million to CGM pursuant to a separate shareholder loan agreement, bringing the total contributions from each shareholder to $5.1 million. The Company expects the entire principal amount of both loans to be converted into equity of CGM by December 31, 2026, subject to the terms and conditions of the respective agreements.
GOGORO INC.
Condensed Consolidated Statements of Changes in Equity
(unaudited)
(in thousands of U.S. dollars)
|
|
|
|
|
|
|
|
|
|
|
|
|
|
|
|
|
|
|
|
|
|
|
|
Ordinary Shares
|
|
Capital Surplus
|
|
Accumulated Deficits
|
|
Exchange Difference on Translation
|
|
Total Equity
|
|
Balance as of December 31, 2025
|
$
|
29
|
|
|
$
|
737,537
|
|
|
$
|
(628,701
|
)
|
|
$
|
(625
|
)
|
|
$
|
108,240
|
|
|
Net loss for the nine months ended September 30, 2026
|
|
—
|
|
|
|
—
|
|
|
|
(16,131
|
)
|
|
|
—
|
|
|
|
(16,131
|
)
|
|
Other comprehensive loss for the nine months ended September 30, 2026
|
|
—
|
|
|
|
—
|
|
|
|
—
|
|
|
|
(874
|
)
|
|
|
(874
|
)
|
|
Changes in percentage of ownership interest in investments accounted for using equity method
|
|
—
|
|
|
|
1
|
|
|
|
—
|
|
|
|
—
|
|
|
|
1
|
|
|
Issuance of ordinary shares
7,8
|
|
11
|
|
|
|
16,684
|
|
|
|
—
|
|
|
|
—
|
|
|
|
16,695
|
|
|
Share-based compensation
|
|
—
|
|
|
|
50
|
|
|
|
—
|
|
|
|
—
|
|
|
|
50
|
|
|
Balance as of September 30, 2026
|
$
|
40
|
|
|
$
|
754,272
|
|
|
$
|
(644,832
|
)
|
|
$
|
(1,499
|
)
|
|
$
|
107,981
|
|
|
|
|
|
|
|
|
|
|
|
|
|
|
_______________________________
7
In March 2026, the Company issued 5,300,000 new ordinary shares to its largest shareholder, Gold Sino Assets Limited, for approximately $16.7 million.
8
On October 13, 2026, subsequent to the reporting period, the Company completed a new round of equity investments previously announced on October 7, 2026. Pursuant to the transaction, the Company issued and sold an aggregate of 24,936,057 ordinary shares, with a par value of US$0.002 per share, at a subscription price of US$2.48 per share, for aggregate proceeds of approximately US$61.8 million, which were received upon closing. The transaction has been recognized in equity in the fourth quarter of 2026. Accordingly, no adjustment has been made to the Company’s consolidated financial statements as of and for the three and nine months ended September 30, 2026. This transaction represents the second and final round of equity funding under Mr. Yin Chung-Yao’s NTD 2.5 billion (approximately US$80 million) funding undertaking made in September 2025. Together with the first round completed in March 2026, the undertaking has been fulfilled.
GOGORO INC.
Reconciliation of IFRS Financial Metrics to Non-IFRS
(unaudited)
(in thousands of U.S. dollars)
|
|
|
|
|
|
|
|
|
|
|
|
|
|
Three Months Ended September 30,
|
|
|
|
|
|
|
2026
|
|
2025
|
|
IFRS revenue YoY change %
|
|
Revenue excluding FX effect YoY change %
|
|
Operating revenues:
|
IFRS revenue
|
|
FX effect
|
|
Revenue excluding FX effect
|
|
IFRS revenue
|
|
|
|
Sales of hardware and others
|
$
|
33,524
|
|
$
|
2,310
|
|
$
|
35,834
|
|
$
|
38,735
|
|
(13.5
|
)%
|
|
(7.5
|
)%
|
|
Battery swapping service
|
|
37,075
|
|
|
2,522
|
|
|
39,597
|
|
|
38,912
|
|
(4.7
|
)%
|
|
1.8
|
%
|
|
Total
|
$
|
70,599
|
|
$
|
4,832
|
|
$
|
75,431
|
|
$
|
77,647
|
|
(9.1
|
)%
|
|
(2.9
|
)%
|
|
|
|
|
|
|
|
|
|
|
|
|
|
|
|
Nine Months Ended September 30,
|
|
|
|
|
|
|
2026
|
|
2025
|
|
IFRS revenue YoY change %
|
|
Revenue excluding FX effect YoY change %
|
|
Operating revenues:
|
IFRS revenue
|
|
FX effect
|
|
Revenue excluding FX effect
|
|
IFRS revenue
|
|
|
|
Sales of hardware and others
|
$
|
93,046
|
|
$
|
2,135
|
|
$
|
95,181
|
|
$
|
96,073
|
|
(3.2
|
)%
|
|
(0.9
|
)%
|
|
Battery swapping service
|
|
111,087
|
|
|
2,054
|
|
|
113,141
|
|
|
111,008
|
|
0.1
|
%
|
|
1.9
|
%
|
|
Total
|
$
|
204,133
|
|
$
|
4,189
|
|
$
|
208,322
|
|
$
|
207,081
|
|
(1.4
|
)%
|
|
0.6
|
%
|
|
|
Three Months Ended September 30,
|
|
Nine Months Ended September 30,
|
|
|
2026
|
|
2025
|
|
2026
|
|
2025
|
|
Gross profit and gross margin
|
$
|
17,228
|
|
24.4
|
%
|
|
$
|
9,492
|
12.2
|
%
|
|
$
|
46,016
|
22.5
|
%
|
|
$
|
12,820
|
6.2
|
%
|
|
Share-based compensation
9
|
|
(36
|
)
|
|
|
|
67
|
|
|
|
36
|
|
|
|
227
|
|
|
Battery upgrade initiatives
|
|
—
|
|
|
|
|
7,688
|
|
|
|
—
|
|
|
|
26,975
|
|
|
Non-IFRS gross profit and gross margin
|
$
|
17,192
|
|
24.4
|
%
|
|
$
|
17,247
|
22.2
|
%
|
|
$
|
46,052
|
22.6
|
%
|
|
$
|
40,022
|
19.3
|
%
|
|
|
|
|
|
|
|
|
|
|
|
|
|
|
|
Three Months Ended September 30,
|
|
Nine Months Ended September 30,
|
|
|
2026
|
|
2025
|
|
2026
|
|
2025
|
|
Net loss
|
$
|
(3,363
|
)
|
|
$
|
(14,942
|
)
|
|
$
|
(16,131
|
)
|
|
$
|
(60,031
|
)
|
|
Share-based compensation
9
|
|
(354
|
)
|
|
|
559
|
|
|
|
50
|
|
|
|
2,328
|
|
|
Change in fair value of financial liabilities
|
|
(204
|
)
|
|
|
(8
|
)
|
|
|
(189
|
)
|
|
|
(1,843
|
)
|
|
Battery upgrade initiatives
|
|
—
|
|
|
|
7,688
|
|
|
|
—
|
|
|
|
26,975
|
|
|
Impairment charges
|
|
—
|
|
|
|
—
|
|
|
|
—
|
|
|
|
1,406
|
|
|
Non-IFRS net loss
|
$
|
(3,921
|
)
|
|
$
|
(6,703
|
)
|
|
$
|
(16,270
|
)
|
|
$
|
(31,165
|
)
|
|
|
|
|
|
|
|
|
|
|
|
Three Months Ended September 30,
|
|
Nine Months Ended September 30,
|
|
|
2026
|
|
2025
|
|
2026
|
|
2025
|
|
Net loss
|
$
|
(3,363
|
)
|
|
$
|
(14,942
|
)
|
|
$
|
(16,131
|
)
|
|
$
|
(60,031
|
)
|
|
Interest expense, net
|
|
2,903
|
|
|
|
3,568
|
|
|
|
8,896
|
|
|
|
9,635
|
|
|
Depreciation and amortization
|
|
20,038
|
|
|
|
23,335
|
|
|
|
61,962
|
|
|
|
68,528
|
|
|
EBITDA
|
|
19,578
|
|
|
|
11,961
|
|
|
|
54,727
|
|
|
|
18,132
|
|
|
Share-based compensation
9
|
|
(354
|
)
|
|
|
559
|
|
|
|
50
|
|
|
|
2,328
|
|
|
Change in fair value of financial liabilities
|
|
(204
|
)
|
|
|
(8
|
)
|
|
|
(189
|
)
|
|
|
(1,843
|
)
|
|
Battery upgrade initiatives
|
|
—
|
|
|
|
7,688
|
|
|
|
—
|
|
|
|
26,975
|
|
|
Impairment charges
|
|
—
|
|
|
|
—
|
|
|
|
—
|
|
|
|
1,406
|
|
|
Adjusted EBITDA
|
$
|
19,020
|
|
|
$
|
20,200
|
|
|
$
|
54,588
|
|
|
$
|
46,998
|
|
|
|
|
|
|
|
|
|
|
|
|
|
|
|
|
|
|
_______________________________
9
Due to an update to the 2026 and 2027 estimated turnover rates in the current quarter, we reversed some of the share-based compensation that was fully expensed in prior quarters.