


NN, Inc. raises 2026 guidance for Net Sales and Adjusted EBITDA, reflecting strong demand and business momentum.
Quiver AI Summary
NN, Inc., a precision manufacturing leader, announced an increase in its full-year 2026 guidance for Net Sales and Adjusted EBITDA. The updated guidance for Net Sales has been raised to a range of $470 million to $490 million, and Adjusted EBITDA has adjusted to $58 million to $68 million, reflecting significant growth compared to 2025. CEO Harold Bevis highlighted the company's momentum in key markets such as Data Center, Defense, and Medical, driving strong demand for their solutions. This optimistic outlook is supported by the company's year-to-date performance and its ongoing investments in growth areas. NN plans to provide more details during its third quarter results announcement on October 28, 2026.
Potential Positives
- NN, Inc. has raised its full-year 2026 guidance for Net Sales and Adjusted EBITDA, reflecting positive business momentum and increased confidence in financial performance.
- The updated guidance indicates a significant increase over the previous year's performance, with projected Net Sales and Adjusted EBITDA showing 14% and 29% growth, respectively.
- The CEO highlighted strong demand in key growth markets such as Data Center, Defense & Electronics, and Medical, signaling robust market opportunities for the company.
- NN, Inc. continues to invest in its growth strategy, which is expected to deliver profitable growth and improved cost productivity, benefiting both customers and shareholders.
Potential Negatives
- Despite raising guidance, the company reported a significant GAAP net loss of $34,004 for the year ended December 31, 2025, which may raise concerns about overall financial health.
- The release emphasizes the use of non-GAAP financial measures, which can obscure actual performance and may not be comparable to peers, potentially leading to investor skepticism.
- The forward-looking statements are accompanied by caution regarding risks and uncertainties, indicating potential volatility in future performance that investors should be wary of.
FAQ
What is the updated guidance for NN, Inc.'s 2026 net sales?
The updated guidance for 2026 net sales is between $470 million and $490 million.
How much has NN, Inc. increased its 2026 Adjusted EBITDA guidance?
NN, Inc. increased its 2026 Adjusted EBITDA guidance by $3 million, now ranging from $58 million to $68 million.
What key markets is NN, Inc. focusing on for growth?
NN, Inc. is focusing on Data Center, Defense & Electronics, and Medical markets for growth.
When will NN, Inc. report its third quarter 2026 results?
NN, Inc. will report its third quarter 2026 results on October 28, 2026.
What is NN, Inc.'s approach to financial performance reporting?
NN, Inc. uses both GAAP and non-GAAP financial measures to evaluate its operating performance and business trends.
Disclaimer: This is an AI-generated summary of a press release distributed by GlobeNewswire. The model used to summarize this release may make mistakes. See the full release here.
$NNBR Insider Trading Activity
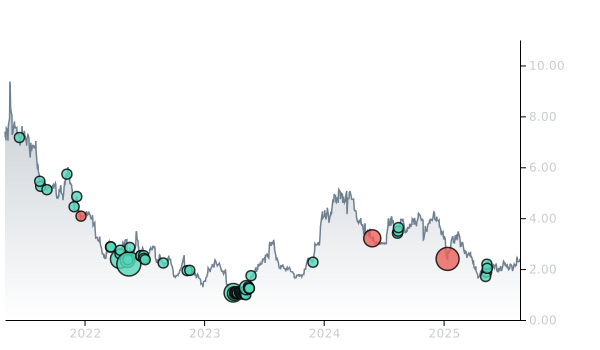
$NNBR insiders have traded $NNBR stock on the open market 28 times in the past 6 months. Of those trades, 0 have been purchases and 28 have been sales.
Here’s a breakdown of recent trading of $NNBR stock by insiders over the last 6 months:
- PARTNERS MANAGEMENT, LLC CORRE has made 0 purchases and 18 sales selling 1,636,916 shares for an estimated $3,929,987.
- JOHN FREDERICK BARRETT has made 0 purchases and 9 sales selling 1,636,916 shares for an estimated $3,929,987.
- RAYMOND T. WHITE sold 18,782 shares for an estimated $45,298
To track insider transactions, check out Quiver Quantitative's insider trading dashboard. You can access data on insider stock transactions through the Quiver Quantitative API insider transaction endpoint.
$NNBR Revenue
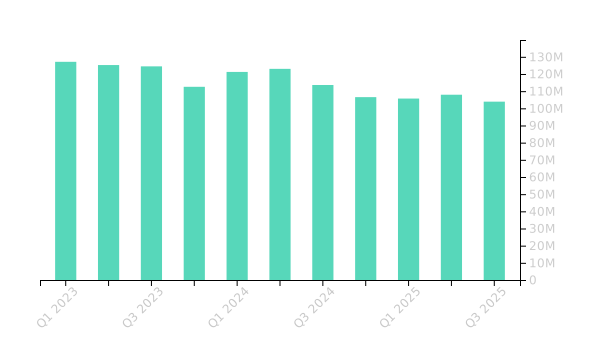
$NNBR had revenues of $128.7M in Q2 2026. This is an increase of 19.29% from the same period in the prior year.
You can track NNBR financials on Quiver Quantitative's NNBR stock page.
You can access data on NNBR stock through the Quiver Quantitative API.
$NNBR Hedge Fund Activity
We have seen 53 institutional investors add shares of $NNBR stock to their portfolio, and 31 decrease their positions in their most recent quarter.
Here are some of the largest recent moves:
- CORRE PARTNERS MANAGEMENT, LLC removed 4,966,994 shares (-80.0%) from their portfolio in Q2 2026, for an estimated $17,831,508
- SG AMERICAS SECURITIES, LLC added 1,940,505 shares (+inf%) to their portfolio in Q2 2026, for an estimated $6,966,412
- TWO SIGMA INVESTMENTS, LP added 1,652,843 shares (+16204.3%) to their portfolio in Q2 2026, for an estimated $5,933,706
- RANGER INVESTMENT MANAGEMENT, L.P. added 568,235 shares (+inf%) to their portfolio in Q2 2026, for an estimated $2,039,963
- WALLEYE CAPITAL LLC added 546,652 shares (+inf%) to their portfolio in Q2 2026, for an estimated $1,962,480
- OAKTREE CAPITAL MANAGEMENT LP added 510,943 shares (+inf%) to their portfolio in Q2 2026, for an estimated $1,834,285
- OAKTREE FUND ADVISORS, LLC added 503,960 shares (+inf%) to their portfolio in Q2 2026, for an estimated $1,809,216
To track hedge funds' stock portfolios, check out Quiver Quantitative's institutional holdings dashboard. You can access data on hedge funds moves and 13F filings through the Quiver Quantitative API 13F endpoint.
Full Release
CHARLOTTE, N.C., Sept. 22, 2026 (GLOBE NEWSWIRE) -- NN, Inc. (NASDAQ: NNBR) a global leader in precision manufacturing, today announced that it is raising its full-year 2026 guidance ranges for Net Sales and Adjusted EBITDA.
Updated Full-Year 2026 Guidance
| Metric | Prior Guidance | Updated Guidance |
| Net Sales | $460 million – $480 million | $470 million – $490 million |
| Adjusted EBITDA | $55 million – $65 million | $58 million – $68 million |
Management’s updated guidance for 2026 Net Sales at midpoint is $480 million, up $58 million, or 14% versus full-year 2025 Net Sales.
Management’s updated guidance for 2026 Adjusted EBITDA at midpoint is $63 million, up $14 million, or 29% versus full-year 2025 Adjusted EBITDA.
Chief Executive Officer Harold Bevis commented, "Our business continues to build momentum as we ramp up in our key growth markets of Data Center, Defense & Electronics, and Medical, where demand for our solutions remains strong and actively expanding. Our year-to-date results and year-to-go forecast underpin this improved guidance and reflect the steady performance our growth and cost programs.
NN is continuing to invest forward in its 5 Pillar growth end markets and this is translating to increased success and higher results. Raising our full-year 2026 guidance for net sales and adjusted EBITDA reflects our confidence in the performance of the business. We remain focused on our balanced plans for delivering profitable growth and improved cost productivity for our customers and shareholders."
NN, Inc. will provide additional detail and updated guidance when it reports third quarter 2026 results on October 28, 2026.
About NN, Inc.
NN, Inc. (NASDAQ: NNBR) is an entrepreneurial manufacturing company specializing in manufacturing micron-toleranced precision metal componentry for high-growth end markets, especially Data Center, Electric Grid, Medical, Defense, and High-Value Vehicle systems. Founded in 1980, NN serves over 700 customers on 4 continents through its 2,550 person workforce operating out of 27 global plants. This footprint enables rapid innovation and global scaled solutions. For more information, visit nninc.com.
Forward Looking Statements
This press release may contain forward-looking statements regarding our business, operations, and financial performance. Such statements are based on current expectations and assumptions that are subject to a number of risks and uncertainties. Actual results could differ materially. Please refer to our most recently filed Form 10-K and our Form 10-Q for the period following that Form 10-K, including the risk factors described therein. We undertake no obligation to update any forward-looking statement, except as required by law. Given these risks and uncertainties, investors are cautioned not to place undue reliance on such forward-looking statements.
This press release contains certain financial measures not presented in accordance with U.S. generally accepted accounting principles (“GAAP”) such as adjusted EBITDA (the “non-GAAP financial measures”). These non-GAAP financial measures are not calculated in accordance with GAAP and should not be considered in isolation from, or as a substitute for, the most directly comparable GAAP measures, and may not be comparable to similarly titled measures used by other companies. Management uses these non-GAAP financial measures, together with the comparable GAAP measures, to evaluate the Company’s operating performance and underlying business trends across periods on a consistent basis, and to assist in operational and financial decision-making, including with respect to internal budgeting and resource allocation. Reconciliations of each non-GAAP financial measure to its most directly comparable GAAP measure are set forth in the tables accompanying this presentation. A reconciliation of forward-looking non-GAAP financial measures to the most directly comparable GAAP measures is not provided because the Company cannot reasonably predict certain items necessary for such reconciliation without unreasonable efforts.
Investor Relations:
Joe Caminiti
[email protected]
312-445-2870
| Reconciliation of GAAP Net Loss to Non-GAAP Adjusted EBITDA | ||||
| Year Ended December 31, | ||||
| (in thousands) |
2025
|
|||
| GAAP net loss | $ | (34,004 | ) | |
| Provision for income taxes | 3,153 | |||
| Interest expense | 22,367 | |||
| Write-off of unamortized debt issuance cost | 3,007 | |||
| Change in fair value of preferred stock derivatives and warrants | (3,331 | ) | ||
| Depreciation and amortization | 35,923 | |||
| Professional fees | 977 | |||
| Personnel costs (1) | 8,739 | |||
| Facility costs (2) | 9,825 | |||
| Non-cash stock compensation | 3,200 | |||
| Non-cash foreign exchange (gain) on inter-company loans | (839 | ) | ||
| Non-GAAP adjusted EBITDA | $ | 49,017 | ||
| (1) Personnel costs include recruitment, retention, relocation, and severance costs | ||||
| (2) Facility costs include costs of opening / closing facilities and relocation / exit of manufacturing operations | ||||