



TransUnion reported significant revenue growth, exceeding guidance, and raised its 2026 financial outlook following strong quarterly performance.
Quiver AI Summary
TransUnion announced its financial performance for Q2 2026, reporting a 15% revenue growth year-over-year, with 10% coming from organic constant currency growth, driven by strong results in U.S. Financial Services and Emerging Verticals. The company's net income rose to $143 million, compared to $110 million in Q2 2025, while adjusted EBITDA increased by 12% to $456 million. Additionally, TransUnion increased its share repurchase activity, bringing the total for the year to around $150 million. The company also raised its full-year 2026 financial guidance, now anticipating revenue growth between 12% to 13%, reflecting robust momentum despite market uncertainties. CEO Chris Cartwright emphasized ongoing efforts for innovation-led growth and key milestones achieved in the first half of the year.
Potential Positives
- Exceeded revenue and Adjusted EBITDA guidance, indicating strong financial performance.
- Achieved a 15 percent increase in revenue, driven by growth in U.S. Financial Services and Emerging Verticals.
- Increased share repurchases to approximately $150 million year-to-date, demonstrating a commitment to returning value to shareholders.
- Raised full-year financial guidance, projecting continued revenue growth of 12% to 13%, underscoring positive momentum moving forward.
Potential Negatives
- Despite a revenue increase, the Adjusted EBITDA margin decreased from 35.7% in the second quarter of 2025 to 34.8% in the second quarter of 2026, indicating a decline in operational efficiency.
- The revenue growth in the U.S. Markets was largely driven by only a few segments, with the Consumer Interactive segment experiencing a significant decline of 3% year-over-year, which raises concerns about diversification and sustainability of growth.
- The increase in cash used in investing activities from $224 million to $681 million may indicate aggressive expansion efforts, which could strain resources and lead to increased financial risk if not managed carefully.
FAQ
What were TransUnion's second quarter 2026 revenue figures?
TransUnion reported total revenue of $1,310 million for Q2 2026, reflecting a 15% increase compared to the previous year.
How much did TransUnion's Adjusted EBITDA grow in Q2 2026?
Adjusted EBITDA increased by 12% in Q2 2026, reaching $456 million compared to $407 million in Q2 2025.
What is the expected revenue growth guidance for full-year 2026?
TransUnion raised its guidance, now expecting revenue growth of 12% to 13% for full-year 2026.
Which segments led TransUnion's revenue growth?
The growth was primarily driven by U.S. Financial Services and Emerging Verticals, with U.S. Markets revenue rising by 11%.
What were TransUnion's diluted earnings per share for Q2 2026?
Diluted earnings per share reached $0.74 in Q2 2026, up from $0.56 in the same period last year.
Disclaimer: This is an AI-generated summary of a press release distributed by GlobeNewswire. The model used to summarize this release may make mistakes. See the full release here.
$TRU Insider Trading Activity
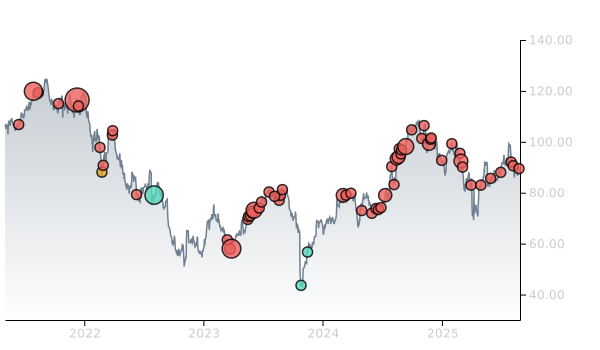
$TRU insiders have traded $TRU stock on the open market 14 times in the past 6 months. Of those trades, 0 have been purchases and 14 have been sales.
Here’s a breakdown of recent trading of $TRU stock by insiders over the last 6 months:
- STEVEN M CHAOUKI (President, US Markets) has made 0 purchases and 4 sales selling 20,000 shares for an estimated $1,446,500.
- HEATHER J RUSSELL (EVP, Chief Legal Officer) has made 0 purchases and 3 sales selling 12,733 shares for an estimated $953,611.
- TODD C. SKINNER (President, International) has made 0 purchases and 5 sales selling 3,500 shares for an estimated $253,330.
- JENNIFER A. WILLIAMS (SVP, Chief Accounting Officer) has made 0 purchases and 2 sales selling 2,651 shares for an estimated $212,080.
To track insider transactions, check out Quiver Quantitative's insider trading dashboard. You can access data on insider stock transactions through the Quiver Quantitative API insider transaction endpoint.
$TRU Revenue
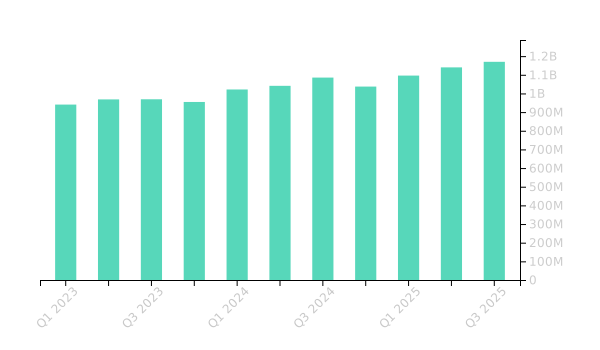
$TRU had revenues of $1.2B in Q1 2026. This is an increase of 13.69% from the same period in the prior year.
You can track TRU financials on Quiver Quantitative's TRU stock page.
You can access data on TRU stock through the Quiver Quantitative API.
$TRU Hedge Fund Activity
We have seen 226 institutional investors add shares of $TRU stock to their portfolio, and 301 decrease their positions in their most recent quarter.
Here are some of the largest recent moves:
- DODGE & COX added 6,347,505 shares (+64.5%) to their portfolio in Q1 2026, for an estimated $439,183,870
- FMR LLC added 5,128,738 shares (+114.7%) to their portfolio in Q1 2026, for an estimated $354,857,382
- INDEPENDENT FRANCHISE PARTNERS LLP added 2,995,041 shares (+32.8%) to their portfolio in Q1 2026, for an estimated $207,226,886
- CITADEL ADVISORS LLC added 2,987,225 shares (+1913.9%) to their portfolio in Q1 2026, for an estimated $206,686,097
- CAPITAL INTERNATIONAL INVESTORS added 2,828,091 shares (+inf%) to their portfolio in Q1 2026, for an estimated $195,675,616
- MASSACHUSETTS FINANCIAL SERVICES CO /MA/ removed 2,393,546 shares (-15.4%) from their portfolio in Q1 2026, for an estimated $165,609,447
- VULCAN VALUE PARTNERS, LLC added 2,144,821 shares (+201.8%) to their portfolio in Q1 2026, for an estimated $148,400,164
To track hedge funds' stock portfolios, check out Quiver Quantitative's institutional holdings dashboard. You can access data on hedge funds moves and 13F filings through the Quiver Quantitative API 13F endpoint.
$TRU Analyst Ratings
Wall Street analysts have issued reports on $TRU in the last several months. We have seen 1 firms issue buy ratings on the stock, and 0 firms issue sell ratings.
Here are some recent analyst ratings:
- Needham issued a "Buy" rating on 02/13/2026
To track analyst ratings and price targets for $TRU, check out Quiver Quantitative's $TRU forecast page.
$TRU Price Targets
Multiple analysts have issued price targets for $TRU recently. We have seen 10 analysts offer price targets for $TRU in the last 6 months, with a median target of $84.0.
Here are some recent targets:
- Sean Kennedy from Mizuho set a target price of $77.0 on 07/02/2026
- Kevin Mcveigh from UBS set a target price of $77.0 on 07/02/2026
- Curtis Nagle from B of A Securities set a target price of $80.0 on 05/19/2026
- Kyle Peterson from Needham set a target price of $95.0 on 04/29/2026
- Andrew Steinerman from JP Morgan set a target price of $90.0 on 04/29/2026
- Toni Kaplan from Morgan Stanley set a target price of $100.0 on 03/11/2026
- Toni Kaplan from Goldman Sachs set a target price of $80.0 on 02/17/2026
Full Release
- Exceeded revenue, Adjusted EBITDA and Adjusted Diluted Earnings Per Share guidance
- Delivered 15 percent revenue growth, or 10 percent organic constant currency, led by U.S. Financial Services and Emerging Verticals
- Increased share repurchases in the second quarter and July, bringing the year-to-date total to approximately $150 million
- Raising full-year 2026 financial guidance; we now expect to deliver 12% to 13% percent revenue growth (8% to 9% organic constant currency)
CHICAGO, July 28, 2026 (GLOBE NEWSWIRE) -- TransUnion (NYSE: TRU) (the “Company”) today announced financial results for the quarter ended June 30, 2026.
Second Quarter 2026 Results
Revenue:
-
Total revenue for the quarter was $1,310 million, an increase of 15 percent (15 percent on a constant currency basis and 10 percent on an organic constant currency basis), compared with the second quarter of 2025.
Earnings:
- Net income attributable to TransUnion was $143 million for the quarter, compared with $110 million for the second quarter of 2025. Diluted earnings per share was $0.74, compared with $0.56 in the second quarter of 2025. Net income attributable to TransUnion margin was 10.9 percent, compared with 9.6 percent in the second quarter of 2025.
- Adjusted Net Income was $238 million for the quarter, compared with $213 million for the second quarter of 2025. Adjusted Diluted Earnings per Share was $1.23, compared with $1.08 in the second quarter of 2025.
-
Adjusted EBITDA was $456 million for the quarter, compared with $407 million for the second quarter of 2025, an increase of 12 percent (12 percent on a constant currency basis and 7 percent on an organic constant currency basis). Adjusted EBITDA margin was 34.8 percent, compared with 35.7 percent in the second quarter of 2025.
“TransUnion delivered another strong quarter of outperformance,” said Chris Cartwright, President and CEO. “U.S. Markets revenue grew by 11 percent, led by U.S. Financial Services and Emerging Verticals. International organic constant currency growth improved to 6 percent, with high-single digit growth in India and the U.K. and 10 percent growth in Canada.”
“We are raising our 2026 guidance, reflecting strong momentum in the first half of the year balanced against continued market uncertainty. We expect to deliver a third consecutive year of at least high-single digit organic constant currency revenue growth and double-digit Adjusted Diluted EPS growth.”
“We continue to execute against our 2026 enterprise priorities to drive innovation-led, scalable growth. We delivered key milestones in the first half of the year, including substantial migrations of our U.S. credit customers to OneTru and an accelerated pace of new product introductions globally. We believe this progress positions us for strong financial performance, free cash generation and shareholder returns in the second half of the year.”
Second Quarter 2026 Segment Results
Segment revenue, Adjusted EBITDA and the related growth rates in the table below include the results of Trans Union de México, S.A. S.I.C. (“Trans Union de Mexico”). The results of this business are reported in the International Segment within Latin America.
| (in millions) |
Second
Quarter 2026 |
Reported
Growth Rate |
Constant Currency Growth Rate | Organic Constant Currency Growth Rate | ||||||||
| U.S. Markets: | ||||||||||||
| Financial Services | $ | 496 | 18 | % | 18 | % | 18 | % | ||||
| Emerging Verticals | 354 | 9 | % | 9 | % | 9 | % | |||||
| Consumer Interactive | 142 | (3 | )% | (3 | )% | (3 | )% | |||||
| Total U.S. Markets Revenue | $ | 993 | 11 | % | 11 | % | 11 | % | ||||
| U.S. Markets Adjusted EBITDA | $ | 361 | 7 | % | 7 | % | 7 | % | ||||
| International: | ||||||||||||
| Canada | $ | 46 | 10 | % | 10 | % | 10 | % | ||||
| Latin America | 93 | 172 | % | 162 | % | 5 | % | |||||
| United Kingdom | 73 | 9 | % | 9 | % | 9 | % | |||||
| Africa | 21 | 16 | % | 5 | % | 5 | % | |||||
| India | 65 | (2 | )% | 8 | % | 8 | % | |||||
| Asia Pacific | 22 | (10 | )% | (7 | )% | (7 | )% | |||||
| Total International Revenue | $ | 321 | 27 | % | 28 | % | 6 | % | ||||
| International Adjusted EBITDA | $ | 137 | 27 | % | 28 | % | 7 | % | ||||
Liquidity and Capital Resources
Cash and cash equivalents was $839 million at June 30, 2026 and $854 million at December 31, 2025.
For the six months ended June 30, 2026, cash provided by operating activities was $459 million, compared with $344 million in 2025. The increase in cash provided by operating activities was due primarily to improved operating performance and changes in working capital. For the six months ended June 30, 2026, cash used in investing activities was $681 million, compared with $224 million in 2025. The increase in cash used in investing activities was due primarily to our acquisitions of Trans Union de Mexico and the mobile division of RealNetworks LLC (“RealNetworks”), partially offset by proceeds from the sale of two Cost Method Investments and a prior year investment in a note receivable. For the six months ended June 30, 2026, capital expenditures were $134 million, compared with $145 million in 2025. Capital expenditures as a percentage of revenue represented 5% and 7%, respectively, for the six months ended June 30, 2026 and 2025. For the six months ended June 30, 2026, cash provided by financing activities was $220 million, compared with cash used in financing activities of $127 million in 2025. The increase in cash provided by financing activities was due primarily to borrowings from the Senior Secured Revolving Credit Facility for the purchase of Trans Union de Mexico, partially offset by higher share repurchase volume in 2026 and dividends paid to shareholders of Trans Union de Mexico.
Third Quarter and Full Year 2026 Outlook
Our guidance is based on a number of assumptions that are subject to change, many of which are outside of the control of the Company, including general macroeconomic conditions, interest rates and inflation. There are numerous evolving factors that we may not be able to accurately predict. There can be no assurance that the Company will achieve the results expressed by this guidance.
|
Three Months Ended
September 30, 2026 |
Twelve Months Ended
December 31, 2026 |
||||||||||||||
| (in millions, except per share data) | Low | High | Low | High | |||||||||||
| Revenue, as reported | $ | 1,292 | $ | 1,310 | $ | 5,127 | $ | 5,162 | |||||||
| Revenue growth 1 : | |||||||||||||||
| As reported | 11 | % | 12 | % | 12 | % | 13 | % | |||||||
| Constant currency 1, 2 | 11 | % | 12 | % | 12 | % | 13 | % | |||||||
| Organic constant currency 1, 3 | 6 | % | 8 | % | 8 | % | 9 | % | |||||||
| Net income attributable to TransUnion | $ | 132 | $ | 138 | $ | 807 | $ | 821 | |||||||
| Net income attributable to TransUnion growth | 37 | % | 43 | % | 77 | % | 80 | % | |||||||
| Net income attributable to TransUnion margin | 10.2 | % | 10.5 | % | 15.7 | % | 15.9 | % | |||||||
| Diluted Earnings per Share | $ | 0.68 | $ | 0.71 | $ | 4.15 | $ | 4.22 | |||||||
| Diluted Earnings per Share growth | 38 | % | 45 | % | 79 | % | 82 | % | |||||||
| Adjusted EBITDA, as reported 5 | $ | 455 | $ | 463 | $ | 1,807 | $ | 1,827 | |||||||
| Adjusted EBITDA growth, as reported 4 | 7 | % | 9 | % | 10 | % | 11 | % | |||||||
| Adjusted EBITDA margin | 35.2 | % | 35.4 | % | 35.2 | % | 35.4 | % | |||||||
| Adjusted Diluted Earnings per Share 5 | $ | 1.18 | $ | 1.21 | $ | 4.75 | $ | 4.83 | |||||||
| Adjusted Diluted Earnings per Share growth | 7 | % | 10 | % | 11 | % | 12 | % | |||||||
-
Additional revenue growth assumptions:
- The impact of changing foreign currency exchange rates is expected to be immaterial for Q3 2026 and for FY 2026.
- The impact of the recent acquisitions is expected to be approximately 4.5 points of benefit for Q3 2026 and approximately 4 points of benefit for FY 2026.
- The impact of FICO mortgage royalty is expected to be approximately 2 points of benefit for Q3 2026 and approximately 3 points of benefit for FY 2026.
- Constant currency growth rates assume foreign currency exchange rates are consistent between years. This allows financial results to be evaluated without the impact of fluctuations in foreign currency exchange rates.
- Organic constant currency growth rates are constant currency growth excluding inorganic growth. Inorganic growth represents growth attributable to the first twelve months of activity for recent business acquisitions, including Trans Union de Mexico, the mobile division of RealNetworks and Monevo.
-
Additional Adjusted EBITDA assumptions:
- The impact of changing foreign currency exchange rates is expected to be immaterial for Q3 2026 and for FY 2026.
-
For a reconciliation of the above non-GAAP financial measures to the most directly comparable GAAP financial measures, refer to Schedule 7 of this Earnings Release.
Earnings Webcast Details
In conjunction with this release, TransUnion will host a conference call and webcast today at 8:30 a.m. Central Time to discuss the business results for the quarter and certain forward-looking information. This session and the accompanying presentation materials may be accessed at www.transunion.com/tru. A replay of the call will also be available at this website following the conclusion of the call.
About TransUnion (NYSE: TRU)
TransUnion is a global information and insights company with over 13,000 associates operating in more than 30 countries. We make trust possible by ensuring each person is reliably represented in the marketplace. We do this with a Tru™ picture of each person: an actionable view of consumers, stewarded with care. Through our acquisitions and technology investments we have developed innovative solutions that extend beyond our strong foundation in core credit into areas such as marketing, fraud, risk and advanced analytics. As a result, consumers and businesses can transact with confidence and achieve great things. We call this Information for Good ® — and it leads to economic opportunity, great experiences and personal empowerment for millions of people around the world.
http://www.transunion.com/business
Availability of Information on TransUnion’s Website
Investors and others should note that TransUnion routinely announces material information to investors and the marketplace using SEC filings, press releases, public conference calls, webcasts and the TransUnion Investor Relations website. While not all of the information that the Company posts to the TransUnion Investor Relations website is of a material nature, some information could be deemed to be material. Accordingly, the Company encourages investors, the media and others interested in TransUnion to review the information that it shares on www.transunion.com/tru.
Forward-Looking Statements
This earnings release contains forward-looking statements within the meaning of the Private Securities Litigation Reform Act of 1995. These statements are based on the current beliefs and expectations of TransUnion’s management and are subject to significant risks and uncertainties. Actual results may differ materially from those described in the forward-looking statements. Any statements made in this earnings release that are not statements of historical fact, including statements about our beliefs, expectations and outlook are forward-looking statements. Forward-looking statements include information concerning possible or assumed future results of operations, including our guidance and descriptions of our business plans and strategies. These statements often include words such as “anticipate,” “expect,” “guidance,” “suggest,” “plan,” “believe,” “intend,” “estimate,” “target,” “project,” “should,” “could,” “would,” “may,” “will,” “forecast,” “outlook,” “potential,” “continues,” “seeks,” “predicts,” or the negatives of these words and other similar expressions.
Factors that could cause actual results to differ materially from those described in the forward-looking statements, or that could materially affect our financial results or such forward-looking statements include:
- macroeconomic effects and changes in market conditions, including the impact of tariffs, inflation, risk of recession, trade policy, and industry trends and adverse developments in the debt, consumer credit and financial services markets, including the impact on the carrying value of our assets in all of the markets where we operate;
- ongoing conflict in the Middle East;
- our ability to provide competitive services and prices;
- our ability to retain or renew existing agreements with large or long-term customers;
- our ability to maintain the security and integrity of our data;
- our ability to deliver services timely without interruption;
- uncertainty related to Fair Isaac Corporation’s (“FICO”) new Mortgage Direct License Program;
- our ability to maintain our access to data sources;
- government regulation and changes in the regulatory environment;
- litigation or regulatory proceedings;
- our approach to the use of artificial intelligence;
- our ability to effectively manage our costs;
- our ability to maintain effective internal control over financial reporting or disclosure controls and procedures;
- economic and political stability in the United States and risks associated with the international markets where we operate;
- our ability to effectively develop and maintain strategic alliances and joint ventures;
- our ability to timely develop new services and the market’s willingness to adopt our new services;
- our ability to manage and expand our operations and keep up with rapidly changing technologies;
- our ability to acquire businesses, successfully secure financing for our acquisitions, timely consummate our acquisitions, successfully integrate the operations of our acquisitions, control the costs of integrating our acquisitions and realize the intended benefits of such acquisitions;
- our ability to protect and enforce our intellectual property, trade secrets and other forms of unpatented intellectual property;
- our ability to defend our intellectual property from infringement claims by third parties;
- the ability of our outside service providers and key vendors to fulfill their obligations to us;
- further consolidation in our end-customer markets;
- the increased availability of free or inexpensive consumer information;
- losses against which we do not insure;
- our ability to make timely payments of principal and interest on our indebtedness;
- our ability to satisfy covenants in the agreements governing our indebtedness;
- our ability to maintain our liquidity;
- stock price volatility;
- share repurchase plans;
- dividend rate;
- our reliance on key management personnel; and
- changes in tax laws or adverse outcomes resulting from examination of our tax returns.
There may be other factors, many of which are beyond our control, that may cause our actual results to differ materially from the forward-looking statements, including factors disclosed in our Annual Report on Form 10-K for the year ended December 31, 2025, and any subsequent Quarterly Report on Form 10-Q or Current Report on Form 8-K filed with the Securities and Exchange Commission. You should evaluate all forward-looking statements made in this report in the context of these risks and uncertainties.
The forward-looking statements contained in this earnings release speak only as of the date of this earnings release. We undertake no obligation to publicly release the result of any revisions to these forward-looking statements to reflect the impact of events or circumstances that may arise after the date of this earnings release.
| For More Information | |
| E-mail: | [email protected] |
| Telephone: | 312.985.2860 |
|
TRANSUNION AND SUBSIDIARIES
Consolidated Balance Sheets (Unaudited) (in millions, except per share data) |
||||||||
|
June 30,
2026 |
December 31,
2025 |
|||||||
| Assets | ||||||||
| Current assets: | ||||||||
| Cash and cash equivalents | $ | 839.1 | $ | 853.6 | ||||
| Trade accounts receivable, net of allowance of $26.6 and $27.7 | 1,047.5 | 905.0 | ||||||
| Other current assets | 291.4 | 257.7 | ||||||
| Total current assets | 2,178.0 | 2,016.3 | ||||||
| Property, plant and equipment, net of accumulated depreciation and amortization of $546.4 and $545.0 | 270.9 | 258.4 | ||||||
| Goodwill | 5,811.8 | 5,259.5 | ||||||
| Other intangibles, net of accumulated amortization of $2,898.8 and $2,716.3 | 3,520.4 | 3,098.5 | ||||||
| Other assets | 408.8 | 480.2 | ||||||
| Total assets | $ | 12,189.9 | $ | 11,112.9 | ||||
| Liabilities and stockholders’ equity | ||||||||
| Current liabilities: | ||||||||
| Trade accounts payable | $ | 404.9 | $ | 349.9 | ||||
| Current portion of long-term debt | 213.1 | 196.9 | ||||||
| Other current liabilities | 528.1 | 607.6 | ||||||
| Total current liabilities | 1,146.1 | 1,154.4 | ||||||
| Long-term debt | 5,372.2 | 4,906.9 | ||||||
| Deferred taxes | 539.2 | 389.8 | ||||||
| Other liabilities | 133.8 | 116.5 | ||||||
| Total liabilities | 7,191.3 | 6,567.6 | ||||||
| Stockholders’ equity: | ||||||||
| Preferred stock, $0.01 par value; 100.0 million shares authorized; none issued or outstanding as of June 30, 2026 and December 31, 2025, respectively | — | — | ||||||
| Common stock, $0.01 par value; 1.0 billion shares authorized at June 30, 2026 and December 31, 2025, 199.0 million and 199.4 million shares issued at June 30, 2026 and December 31, 2025, respectively, and 191.6 million and 192.4 million shares outstanding as of June 30, 2026 and December 31, 2025, respectively | 1.9 | 2.0 | ||||||
| Additional paid-in capital | 2,390.9 | 2,424.0 | ||||||
| Treasury stock at cost; 7.4 million and 7.0 million shares at June 30, 2026 and December 31, 2025, respectively | (402.5 | ) | (370.3 | ) | ||||
| Retained earnings | 3,214.9 | 2,723.7 | ||||||
| Accumulated other comprehensive loss | (362.3 | ) | (340.2 | ) | ||||
| Total TransUnion stockholders’ equity | 4,842.9 | 4,439.2 | ||||||
| Noncontrolling interests | 155.7 | 106.1 | ||||||
| Total stockholders’ equity | 4,998.6 | 4,545.3 | ||||||
| Total liabilities and stockholders’ equity | $ | 12,189.9 | $ | 11,112.9 | ||||
|
TRANSUNION AND SUBSIDIARIES
Consolidated Statements of Operations (Unaudited) (in millions, except per share data) |
|||||||||||||||
| Three Months Ended June 30, | Six Months Ended June 30, | ||||||||||||||
| 2026 | 2025 | 2026 | 2025 | ||||||||||||
| Revenue | $ | 1,309.6 | $ | 1,139.7 | $ | 2,555.3 | $ | 2,235.5 | |||||||
| Operating expenses | |||||||||||||||
| Cost of services (exclusive of depreciation and amortization below) | 544.6 | 469.9 | 1,064.1 | 915.5 | |||||||||||
| Selling, general and administrative | 346.5 | 335.0 | 675.5 | 591.8 | |||||||||||
| Depreciation and amortization | 160.5 | 142.7 | 312.9 | 281.6 | |||||||||||
| Total operating expenses | 1,051.6 | 947.5 | 2,052.5 | 1,788.9 | |||||||||||
| Operating income | 258.0 | 192.2 | 502.8 | 446.6 | |||||||||||
| Non-operating income and (expense) | |||||||||||||||
| Interest expense | (65.9 | ) | (55.7 | ) | (127.9 | ) | (111.8 | ) | |||||||
| Interest income | 7.0 | 8.8 | 14.2 | 17.3 | |||||||||||
| Earnings from equity method investments | 0.9 | 5.0 | 7.4 | 9.3 | |||||||||||
| Gain on acquisition of affiliate | — | — | 225.5 | — | |||||||||||
| Other income and (expense), net | 1.5 | 6.6 | 7.7 | (10.8 | ) | ||||||||||
| Total non-operating income and (expense) | (56.5 | ) | (35.4 | ) | 126.8 | (96.0 | ) | ||||||||
| Income before income taxes | 201.5 | 156.8 | 629.6 | 350.5 | |||||||||||
| Provision for income taxes | (54.8 | ) | (44.4 | ) | (82.4 | ) | (85.4 | ) | |||||||
| Net income | 146.7 | 112.4 | 547.2 | 265.1 | |||||||||||
| Less: net income attributable to noncontrolling interests | (3.4 | ) | (2.8 | ) | (6.7 | ) | (7.4 | ) | |||||||
| Net income attributable to TransUnion | $ | 143.4 | $ | 109.6 | $ | 540.5 | $ | 257.7 | |||||||
| Basic earnings per common share from: | |||||||||||||||
| Net income attributable to TransUnion | $ | 0.75 | $ | 0.56 | $ | 2.81 | $ | 1.32 | |||||||
| Diluted earnings per common share from: | |||||||||||||||
| Net income attributable to TransUnion | $ | 0.74 | $ | 0.56 | $ | 2.78 | $ | 1.31 | |||||||
| Weighted-average shares outstanding: | |||||||||||||||
| Basic | 192.3 | 195.0 | 192.5 | 195.0 | |||||||||||
| Diluted | 193.7 | 197.2 | 194.3 | 197.2 | |||||||||||
As a result of displaying amounts in millions, rounding differences may exist in the table above.
|
TRANSUNION AND SUBSIDIARIES
Consolidated Statements of Cash Flows (Unaudited) (in millions) |
|||||||
| Six Months Ended June 30, | |||||||
| 2026 | 2025 | ||||||
| Cash flows from operating activities: | |||||||
| Net income | $ | 547.2 | $ | 265.1 | |||
| Adjustments to reconcile net income to net cash provided by operating activities: | |||||||
| Depreciation and amortization | 312.9 | 281.6 | |||||
| Deferred taxes | (21.3 | ) | (54.1 | ) | |||
| Stock-based compensation | 76.6 | 70.5 | |||||
| Gain on acquisition of affiliate | (225.5 | ) | — | ||||
| Other | (10.5 | ) | 29.1 | ||||
| Changes in assets and liabilities: | |||||||
| Trade accounts receivable | (144.4 | ) | (98.4 | ) | |||
| Other current and long-term assets | (20.2 | ) | 8.0 | ||||
| Trade accounts payable | 44.0 | 37.1 | |||||
| Other current and long-term liabilities | (99.7 | ) | (195.1 | ) | |||
| Cash provided by operating activities | 459.1 | 343.8 | |||||
| Cash flows from investing activities: | |||||||
| Capital expenditures | (134.4 | ) | (145.4 | ) | |||
| Proceeds from sale/maturity of other investments | — | 0.2 | |||||
| Investments in consolidated affiliates, net of cash acquired | (603.6 | ) | (55.7 | ) | |||
| Investments in nonconsolidated affiliates and notes receivable | (1.0 | ) | (25.0 | ) | |||
| Proceeds from the sale of investments in nonconsolidated affiliates | 47.3 | — | |||||
| Other | 10.8 | 2.2 | |||||
| Cash used in investing activities | (680.9 | ) | (223.7 | ) | |||
| Cash flows from financing activities: | |||||||
| Proceeds from revolving credit facility | 520.0 | — | |||||
| Repayments of debt | (40.8 | ) | (43.2 | ) | |||
| Debt financing fees | (0.7 | ) | — | ||||
| Dividends to shareholders | (49.5 | ) | (45.1 | ) | |||
| Proceeds from issuance of common stock and exercise of stock options | 9.8 | 10.5 | |||||
| Employee taxes paid on restricted stock units recorded as treasury stock | (32.3 | ) | (7.4 | ) | |||
| Repurchases of common stock | (115.8 | ) | (38.8 | ) | |||
| Acquisitions of noncontrolling interests | (8.6 | ) | — | ||||
| Distributions to noncontrolling interests | (6.4 | ) | (3.3 | ) | |||
| Dividends paid to shareholders of acquired affiliate | (56.1 | ) | — | ||||
| Cash provided by (used in) financing activities | 219.6 | (127.3 | ) | ||||
| Effect of exchange rate changes on cash and cash equivalents | (12.3 | ) | 15.2 | ||||
| Net change in cash and cash equivalents | (14.5 | ) | 8.0 | ||||
| Cash and cash equivalents, beginning of period | 853.6 | 679.5 | |||||
| Cash and cash equivalents, end of period | $ | 839.1 | $ | 687.5 | |||
As a result of displaying amounts in millions, rounding differences may exist in the table above.
TRANSUNION AND SUBSIDIARIES
Non-GAAP Financial Measures
We present Consolidated Adjusted EBITDA, Consolidated Adjusted EBITDA Margin, Adjusted Net Income, Adjusted Diluted Earnings per Share, Adjusted Provision for Income Taxes, Adjusted Effective Tax Rate and Leverage Ratio for all periods presented. These are important financial measures for the Company but are not financial measures as defined by GAAP. These financial measures should be reviewed in conjunction with the relevant GAAP financial measures and are not presented as alternative measures of GAAP. Other companies in our industry may define or calculate these measures differently than we do, limiting their usefulness as comparative measures. Because of these limitations, these non-GAAP financial measures should not be considered in isolation or as substitutes for performance measures calculated in accordance with GAAP, including operating income, operating margin, effective tax rate, net income attributable to the Company, diluted earnings per share or cash provided by operating activities. Reconciliations of these non-GAAP financial measures to their most directly comparable GAAP financial measures are presented in the tables below.
We present Consolidated Adjusted EBITDA, Consolidated Adjusted EBITDA Margin, Adjusted Net Income, Adjusted Diluted Earnings per Share, Adjusted Provision for Income Taxes and Adjusted Effective Tax Rate as supplemental measures of our operating performance because these measures eliminate the impact of certain items that we do not consider indicative of our cash operations and ongoing operating performance. These are measures frequently used by securities analysts, investors and other interested parties in their evaluation of the operating performance of companies similar to ours.
Our board of directors and executive management team use Adjusted EBITDA as an incentive compensation measure for most eligible employees and Adjusted Diluted Earnings per Share as an incentive compensation measure for certain of our senior executives.
Under the credit agreement governing our Senior Secured Credit Facility, our ability to engage in activities such as incurring additional indebtedness, making investments and paying dividends is tied to our Leverage Ratio which is partially based on Adjusted EBITDA. Investors also use our Leverage Ratio to assess our ability to service our debt and make other capital allocation decisions.
Consolidated Adjusted EBITDA
Management has excluded the following items from net income attributable to TransUnion in order to calculate Adjusted EBITDA for the periods presented:
- Net interest expense is the sum of interest expense and interest income as reported on our Consolidated Statements of Operations.
- Provision for income taxes, as reported on our Consolidated Statements of Operations.
- Depreciation and amortization, as reported on our Consolidated Statements of Operations.
- Stock-based compensation is used as an incentive to engage and retain our employees. It is predominantly a non-cash expense. We exclude stock-based compensation because it may not correlate to the underlying performance of our business operations during the period since it is measured at the grant date fair value and it is subject to variability as a result of performance conditions and timing of grants. These expenses are reported within cost of services and selling, general and administrative on our Consolidated Statements of Operations.
- Mergers and acquisitions, divestitures and business optimization expenses are non-recurring expenses associated with specific transactions (exploratory or executed) and consist of (i) transaction and integration costs, (ii) fair value and impairment adjustments related to investments and related call and put options, notes receivable, gains or losses on a step acquisition and mark-to-market adjustments on acquisition-related foreign currency forward contracts, (iii) post-acquisition adjustments to contingent consideration or to assets and liabilities that occurred after the acquisition measurement period. We exclude these expenses as we believe they are not directly correlated to the underlying performance of our business operations and vary depending upon the timing of such transactions. These expenses are reported in costs of services, selling, general and administrative and other income and (expenses), net, on our Consolidated Statements of Operations.
- Accelerated technology investment includes Project Rise and the final phase of our technology investment announced in November 2023. Project Rise was announced in February 2020 and was originally expected to be completed in 2022. Following our acquisition of Neustar in December 2021, we recognized the opportunity to take advantage of Neustar’s capabilities to enhance and complement our cloud-based technology already under development as part of Project Rise. As a result, we extended Project Rise’s timeline to 2024. In November 2023, we announced our plans to further leverage Neustar’s technology to standardize and streamline our product delivery platforms and to build a single global platform for fulfillment of our product lines. This represented the final phase of the technology investment in our global technology infrastructure and core customer applications. The accelerated technology investment fundamentally transformed our technology infrastructure by implementing a global cloud-based approach to streamline product development, increase the efficiency of ongoing operations and maintenance and enable a continuous improvement approach to avoid the need for another major technology overhaul in the foreseeable future. The unique effort to build a secure, reliable and performant hybrid cloud infrastructure required us to dedicate separate resources in order to develop the new cloud-based infrastructure in parallel with our current on-premise environment by maintaining our existing technology team to ensure no disruptions to our customers. The costs associated with the accelerated technology investment are incremental and redundant costs that will not recur now that the program has been completed and are not representative of our underlying operating performance. Therefore, we believe that excluding these costs through the end of the program in 2025 from our non-GAAP measures provides a better reflection of our ongoing cost structure. These costs are primarily reported in cost of services and therefore do not include amounts that are capitalized as internally developed software.
- Operating model optimization program represents employee separation costs, facility lease exit costs and other business process optimization expenses incurred in connection with our transformation plan. We excluded these expenses through the end of the program in 2025 as we believe they are not directly correlated to the underlying performance of our business. Further, these costs will vary and may not be comparable during the transformation initiative as we progress toward an optimized operating model. These costs are reported primarily in restructuring and selling, general and administrative on our Consolidated Statements of Operations.
- Net other adjustments principally relate to: (i) deferred loan fee expense from debt prepayments and refinancing, (ii) other debt financing expenses consisting primarily of revolving credit facility deferred financing fee amortization and commitment fees and expenses associated with ratings agencies and interest rate hedging, (iii) currency remeasurement on foreign operations, (iv) legal and regulatory expenses, net, and (v) other non-operating (income) and expense. We exclude these expenses as we believe they are not directly correlated to the underlying performance of our business and create variability between periods based on the nature and timing of the expense or income. These costs are reported in selling, general and administrative and in non-operating income and expense, net as applicable based on their nature on our Consolidated Statements of Operations.
Consolidated Adjusted EBITDA Margin
Management defines Consolidated Adjusted EBITDA Margin as Consolidated Adjusted EBITDA divided by total revenue as reported.
Adjusted Net Income
Management has excluded the following items from net income attributable to TransUnion in order to calculate Adjusted Net Income for the periods presented:
- Amortization of certain intangible assets presents non-cash amortization expenses related to assets that arose from our 2012 change in control transaction and business combinations occurring after our 2012 change in control. We exclude these expenses as we believe they are not directly correlated to the underlying performance of our business operations and vary dependent upon the timing of the transactions that give rise to these assets. Amortization of intangible assets is included in depreciation and amortization on our Consolidated Statements of Operations.
- Stock-based compensation (see Consolidated Adjusted EBITDA above)
- Mergers and acquisitions, divestiture and business optimization (see Consolidated Adjusted EBITDA above)
- Accelerated technology investment (see Consolidated Adjusted EBITDA above)
- Operating model optimization program (see Consolidated Adjusted EBITDA above)
- Net other is consistent with the definition in Consolidated Adjusted EBITDA above except that other debt financing expenses and certain other miscellaneous income and expense that are included in the adjustment to calculate Adjusted EBITDA are excluded in the adjustment made to calculate Adjusted Net Income.
-
Total adjustments for income taxes
relates to the cumulative adjustments discussed below for Adjusted Provision for Income Taxes. This adjustment is made for the reasons indicated in Adjusted Provision for Income Taxes below. Adjustments related to the provision for income taxes are included in the line item by this name on our Consolidated Statement of Operations.
Adjusted Diluted Earnings Per Share
Management defines Adjusted Diluted Earnings per Share as Adjusted Net Income divided by the weighted-average diluted shares outstanding.
Adjusted Provision for Income Taxes
Management has excluded the following items from our provision for income taxes for the periods presented:
- Tax effect of above adjustments represents the income tax effect of the adjustments related to Adjusted Net Income described above. The tax rate applied to each adjustment is based on the nature of each line item. We include the tax effect of the adjustments made to Adjusted Net Income to provide a comprehensive view of our adjusted net income.
- Excess tax (benefit) expense for stock-based compensation is the permanent difference between expenses recognized for book purposes and expenses recognized for tax purposes, in each case related to stock-based compensation expense. We exclude this amount from the Adjusted Provision for Income Taxes in order to be consistent with the exclusion of stock-based compensation from the calculation of Adjusted Net Income.
-
Other
principally relates to (i) deferred tax adjustments, including rate changes, (ii) infrequent or unusual valuation allowance adjustments, (iii) return to provision, tax authority audit adjustments, and reserves related to prior periods, and (iv) other non-recurring items. We exclude these items because they create variability that impacts comparability between periods.
Adjusted Effective Tax Rate
Management defines Adjusted Effective Tax Rate as Adjusted Provision for Income Taxes divided by Adjusted income before income taxes. We calculate adjusted income before income taxes by excluding the pre-tax adjustments in the calculation of Adjusted Net Income discussed above and noncontrolling interest related to these pre-tax adjustments from income before income taxes.
Leverage Ratio
Management defines Leverage Ratio as net debt divided by Consolidated Adjusted EBITDA for the most recent twelve-month period including twelve months of Adjusted EBITDA from significant acquisitions. Net debt is defined as total debt less cash and cash equivalents as reported on the balance sheet as of the end of the period.
This earnings release presents constant currency growth rates assuming foreign currency exchange rates are consistent between years. This allows financial results to be evaluated without the impact of fluctuations in foreign currency exchange rates. This earnings release also presents organic constant currency growth rates, which assumes consistent foreign currency exchange rates between years and also eliminates the impact of our recent acquisitions. This allows financial results to be evaluated without the impact of fluctuations in foreign currency exchange rates and the impacts of recent acquisitions.
Free cash flow is defined as cash provided by operating activities less capital expenditures and is a measure we may refer to.
Refer to Schedules 1 through 7 for a reconciliation of our non-GAAP financial measures to the most directly comparable GAAP financial measure.
|
SCHEDULE 1
TRANSUNION AND SUBSIDIARIES Revenue and Adjusted EBITDA growth rates as Reported, CC, and Organic CC (Unaudited) |
|||||||||||||||||||||||
|
For the Three Months Ended June 30, 2026 compared with
the Three Months Ended June 30, 2025 |
For the Six Months Ended June 30, 2026 compared with
the Six Months Ended June 30, 2025 |
||||||||||||||||||||||
| Reported | CC Growth 1 | Inorganic | Organic CC Growth 2 | Reported | CC Growth 1 | Inorganic | Organic CC Growth 2 | ||||||||||||||||
| Revenue: | |||||||||||||||||||||||
| Consolidated | 14.9 | % | 15.0 | % | 4.9 | % | 10.1 | % | 14.3 | % | 14.0 | % | 3.6 | % | 10.4 | % | |||||||
| U.S. Markets | 11.5 | % | 11.5 | % | 0.3 | % | 11.2 | % | 12.6 | % | 12.6 | % | 0.2 | % | 12.4 | % | |||||||
| Financial Services | 18.2 | % | 18.2 | % | — | % | 18.2 | % | 21.0 | % | 21.0 | % | — | % | 21.0 | % | |||||||
| Emerging Verticals | 9.4 | % | 9.4 | % | 0.7 | % | 8.6 | % | 7.8 | % | 7.8 | % | 0.4 | % | 7.5 | % | |||||||
| Consumer Interactive | (3.0) | % | (3.0) | % | — | % | (3.0) | % | (0.9) | % | (1.0) | % | 0.4 | % | (1.4) | % | |||||||
| International | 26.9 | % | 27.5 | % | 21.2 | % | 6.3 | % | 20.1 | % | 18.9 | % | 15.5 | % | 3.4 | % | |||||||
| Canada | 9.7 | % | 9.6 | % | — | % | 9.6 | % | 11.9 | % | 9.4 | % | — | % | 9.4 | % | |||||||
| Latin America | 171.8 | % | 162.1 | % | 157.5 | % | 4.7 | % | 119.2 | % | 110.3 | % | 107.8 | % | 2.5 | % | |||||||
| United Kingdom | 9.3 | % | 8.6 | % | — | % | 8.6 | % | 15.6 | % | 11.4 | % | 3.8 | % | 7.9 | % | |||||||
| Africa | 15.8 | % | 4.9 | % | — | % | 4.9 | % | 19.4 | % | 7.1 | % | — | % | 7.1 | % | |||||||
| India | (2.3) | % | 8.0 | % | — | % | 8.0 | % | (6.4) | % | 1.2 | % | — | % | 1.2 | % | |||||||
| Asia Pacific | (9.6) | % | (6.9) | % | — | % | (6.9) | % | (14.2) | % | (12.5) | % | — | % | (12.5) | % | |||||||
| Adjusted EBITDA: | |||||||||||||||||||||||
| Consolidated | 12.1 | % | 12.5 | % | 5.4 | % | 7.1 | % | 11.2 | % | 11.0 | % | 4.1 | % | 6.9 | % | |||||||
| U.S. Markets | 7.1 | % | 7.0 | % | (0.2) | % | 7.3 | % | 9.2 | % | 9.2 | % | — | % | 9.2 | % | |||||||
| International | 26.7 | % | 28.3 | % | 20.9 | % | 7.4 | % | 18.7 | % | 18.1 | % | 15.2 | % | 2.9 | % | |||||||
1. Constant Currency (“CC”) growth rates assume foreign currency exchange rates are consistent between years. This allows financial results to be evaluated without the impact of fluctuations in foreign currency exchange rates.
2. Organic CC growth rate is the CC growth rate less inorganic growth rate.
|
SCHEDULE 2
TRANSUNION AND SUBSIDIARIES Consolidated and Segment Revenue, Adjusted EBITDA, and Adjusted EBITDA Margin (Unaudited) (dollars in millions) |
|||||||||||||||
| Three Months Ended June 30, | Six Months Ended June 30, | ||||||||||||||
| 2026 | 2025 | 2026 | 2025 | ||||||||||||
| Revenue: | |||||||||||||||
| U.S. Markets gross revenue | |||||||||||||||
| Financial Services | $ | 496.3 | $ | 419.9 | $ | 996.8 | $ | 823.5 | |||||||
| Emerging Verticals | 353.9 | 323.6 | 688.5 | 638.5 | |||||||||||
| Consumer Interactive | 142.5 | 146.9 | 282.4 | 285.1 | |||||||||||
| U.S. Markets gross revenue | $ | 992.7 | $ | 890.4 | $ | 1,967.8 | $ | 1,747.0 | |||||||
| International gross revenue | |||||||||||||||
| Canada | $ | 46.4 | $ | 42.3 | $ | 89.7 | $ | 80.1 | |||||||
| Latin America | 92.7 | 34.1 | 146.6 | 66.9 | |||||||||||
| United Kingdom | 73.5 | 67.2 | 145.7 | 126.1 | |||||||||||
| Africa | 21.0 | 18.2 | 41.9 | 35.1 | |||||||||||
| India | 65.1 | 66.6 | 126.6 | 135.3 | |||||||||||
| Asia Pacific | 22.1 | 24.5 | 44.2 | 51.5 | |||||||||||
| International gross revenue | $ | 320.8 | $ | 252.9 | $ | 594.8 | $ | 495.0 | |||||||
| Total gross revenue | $ | 1,313.5 | $ | 1,143.2 | $ | 2,562.5 | $ | 2,242.1 | |||||||
| Intersegment revenue eliminations | |||||||||||||||
| U.S. Markets | $ | (2.0 | ) | $ | (1.9 | ) | $ | (3.9 | ) | $ | (3.5 | ) | |||
| International | (1.8 | ) | (1.6 | ) | (3.3 | ) | (3.1 | ) | |||||||
| Total intersegment revenue eliminations | $ | (3.8 | ) | $ | (3.5 | ) | $ | (7.3 | ) | $ | (6.6 | ) | |||
| Total revenue as reported | $ | 1,309.6 | $ | 1,139.7 | $ | 2,555.3 | $ | 2,235.5 | |||||||
| Adjusted EBITDA: | |||||||||||||||
| U.S. Markets | $ | 361.0 | $ | 337.2 | $ | 717.9 | $ | 657.4 | |||||||
| International | 136.8 | 108.0 | 258.5 | 217.8 | |||||||||||
| Corporate | (41.7 | ) | (38.2 | ) | (82.4 | ) | (71.0 | ) | |||||||
| Adjusted EBITDA Margin: 1 | |||||||||||||||
| U.S. Markets | 36.4 | % | 37.9 | % | 36.5 | % | 37.6 | % | |||||||
| International | 42.7 | % | 42.7 | % | 43.5 | % | 44.0 | % | |||||||
1. Segment Adjusted EBITDA Margins are calculated using segment gross revenue and segment Adjusted EBITDA. Consolidated Adjusted EBITDA Margin is calculated using total revenue as reported and consolidated Adjusted EBITDA.
| Three Months Ended June 30, | Six Months Ended June 30, | ||||||||||||||
| 2026 | 2025 | 2026 | 2025 | ||||||||||||
| Reconciliation of Net income attributable to TransUnion to consolidated Adjusted EBITDA: | |||||||||||||||
| Net income attributable to TransUnion | $ | 143.4 | $ | 109.6 | $ | 540.5 | $ | 257.7 | |||||||
| Net interest expense | 58.9 | 47.0 | 113.8 | 94.5 | |||||||||||
| Provision for income taxes | 54.8 | 44.4 | 82.4 | 85.4 | |||||||||||
| Depreciation and amortization | 160.5 | 142.7 | 312.9 | 281.6 | |||||||||||
| EBITDA | $ | 417.6 | $ | 343.7 | $ | 1,049.5 | $ | 719.2 | |||||||
| Expense and (income) adjustments to EBITDA: | |||||||||||||||
| Stock-based compensation | 39.1 | 40.2 | 76.6 | 70.5 | |||||||||||
| Mergers and acquisitions, divestitures and business optimization 1 | (1.3 | ) | (4.6 | ) | (233.6 | ) | 13.2 | ||||||||
| Accelerated technology investment 2 | — | 23.2 | — | 43.3 | |||||||||||
| Operating model optimization program 3 | — | 5.4 | — | 15.2 | |||||||||||
| Net other 4 | 0.7 | (0.8 | ) | 1.4 | (57.3 | ) | |||||||||
| Total adjustments to EBITDA | $ | 38.5 | $ | 63.3 | $ | (155.5 | ) | $ | 85.0 | ||||||
| Consolidated Adjusted EBITDA | $ | 456.1 | $ | 407.0 | $ | 894.0 | $ | 804.1 | |||||||
| Net income attributable to TransUnion margin | 10.9 | % | 9.6 | % | 21.2 | % | 11.5 | % | |||||||
| Consolidated Adjusted EBITDA margin 5 | 34.8 | % | 35.7 | % | 35.0 | % | 36.0 | % | |||||||
As a result of displaying amounts in millions, rounding differences may exist in the tables above and footnotes below.
1. Mergers and acquisitions, divestitures and business optimization consisted of the following adjustments:
| Three Months Ended June 30, | Six Months Ended June 30, | |||||||||||||||
| 2026 | 2025 | 2026 | 2025 | |||||||||||||
| Transaction and integration costs | $ | (0.9 | ) | $ | 2.9 | $ | 7.6 | $ | 8.2 | |||||||
| Fair value and impairment adjustments | (0.3 | ) | (7.6 | ) | (241.2 | ) | 5.0 | |||||||||
| Total mergers and acquisitions, divestitures and business optimization | $ | (1.3 | ) | $ | (4.6 | ) | $ | (233.6 | ) | $ | 13.2 | |||||
For the six months ended June 30, 2026, fair value and impairment adjustments includes the gain on our acquisition of Trans Union de Mexico.
2. Represents expenses associated with our accelerated technology investment to migrate to the cloud. There are three components of the accelerated technology investment: (i) building foundational capabilities, which includes establishing a modern, API-based and services-oriented software architecture, (ii) the migration of each application and customer data to the new enterprise platform, including the redundant software costs during the migration period, as well as the efforts to decommission the legacy system, and (iii) program enablement, which includes dedicated resources to support the planning and execution of the program. The amounts for each category of cost are as follows:
|
Three Months Ended
June 30, |
Six Months Ended
June 30, |
||||||
| 2025 | 2025 | ||||||
| Foundational Capabilities | $ | 4.2 | $ | 11.7 | |||
| Migration Management | 19.0 | 31.6 | |||||
| Total accelerated technology investment | $ | 23.2 | $ | 43.3 | |||
3. Operating model optimization consisted of the following adjustments:
|
Three Months Ended
June 30, |
Six Months Ended
June 30, |
||||||
| 2025 | 2025 | ||||||
| Business process optimization | $ | 5.4 | $ | 15.2 | |||
| Total operating model optimization | $ | 5.4 | $ | 15.2 | |||
4. Net other consisted of the following adjustments:
|
Three Months Ended
June 30, |
Six Months Ended
June 30, |
||||||||||||||
| 2026 | 2025 | 2026 | 2025 | ||||||||||||
| Deferred loan fee expense from debt prepayments and refinancing | $ | — | $ | — | $ | — | $ | (0.1 | ) | ||||||
| Other debt financing expenses | 0.5 | 0.6 | 1.0 | 1.1 | |||||||||||
| Currency remeasurement on foreign operations | (0.5 | ) | (1.5 | ) | 1.1 | (2.1 | ) | ||||||||
| Legal and regulatory expenses, net | — | — | — | (56.0 | ) | ||||||||||
| Other non-operating (income) expense | 0.7 | 0.2 | (0.6 | ) | (0.1 | ) | |||||||||
| Total other adjustments | $ | 0.7 | $ | (0.8 | ) | $ | 1.4 | $ | (57.3 | ) | |||||
5. Consolidated Adjusted EBITDA margin is calculated by dividing Consolidated Adjusted EBITDA by total revenue.
|
SCHEDULE 3
TRANSUNION AND SUBSIDIARIES Adjusted Net Income and Adjusted Diluted Earnings Per Share (Unaudited) (in millions, except per share data) |
|||||||||||||||
|
Three Months Ended
June 30, |
Six Months Ended
June 30, |
||||||||||||||
| 2026 | 2025 | 2026 | 2025 | ||||||||||||
| Net Income attributable to TransUnion | $ | 143.4 | $ | 109.6 | $ | 540.5 | $ | 257.7 | |||||||
| Weighted-average shares outstanding: | |||||||||||||||
| Basic | 192.3 | 195.0 | 192.5 | 195.0 | |||||||||||
| Diluted | 193.7 | 197.2 | 194.3 | 197.2 | |||||||||||
| Basic earnings per common share from: | |||||||||||||||
| Net income attributable to TransUnion | $ | 0.75 | $ | 0.56 | $ | 2.81 | $ | 1.32 | |||||||
| Diluted earnings per common share from: | |||||||||||||||
| Net income attributable to TransUnion | $ | 0.74 | $ | 0.56 | $ | 2.78 | $ | 1.31 | |||||||
| Reconciliation of Net income attributable to TransUnion to Adjusted Net Income: | |||||||||||||||
| Net income attributable to TransUnion | $ | 143.4 | $ | 109.6 | $ | 540.5 | $ | 257.7 | |||||||
| Expense and (income) adjustments before income tax items: | |||||||||||||||
| Amortization of certain intangible assets | 82.9 | 73.1 | 159.4 | 143.9 | |||||||||||
| Stock-based compensation | 39.1 | 40.2 | 76.6 | 70.5 | |||||||||||
| Mergers and acquisitions, divestitures and business optimization 1 | (1.3 | ) | (4.6 | ) | (233.6 | ) | 13.2 | ||||||||
| Accelerated technology investment 2 | — | 23.2 | — | 43.3 | |||||||||||
| Operating model optimization program 3 | — | 5.4 | — | 15.2 | |||||||||||
| Net other 4 | (0.5 | ) | (1.5 | ) | 1.1 | (58.2 | ) | ||||||||
| Total adjustments before income tax items | $ | 120.3 | $ | 135.6 | $ | 3.6 | $ | 227.9 | |||||||
| Total adjustments for income taxes 5 | (26.1 | ) | (32.1 | ) | (76.3 | ) | (64.8 | ) | |||||||
| Adjusted Net Income | $ | 237.6 | $ | 213.1 | $ | 467.8 | $ | 420.7 | |||||||
| Weighted-average shares outstanding: | |||||||||||||||
| Basic | 192.3 | 195.0 | 192.5 | 195.0 | |||||||||||
| Diluted | 193.7 | 197.2 | 194.3 | 197.2 | |||||||||||
| Adjusted Earnings per Share: | |||||||||||||||
| Basic | $ | 1.24 | $ | 1.09 | $ | 2.43 | $ | 2.16 | |||||||
| Diluted | $ | 1.23 | $ | 1.08 | $ | 2.41 | $ | 2.13 | |||||||
|
Three Months Ended
June 30, |
Six Months Ended
June 30, |
||||||||||||||
| 2026 | 2025 | 2026 | 2025 | ||||||||||||
| Reconciliation of Diluted earnings per share from Net income attributable to TransUnion to Adjusted Diluted Earnings per Share: | |||||||||||||||
| Diluted earnings per common share from: | |||||||||||||||
| Net income attributable to TransUnion | $ | 0.74 | $ | 0.56 | $ | 2.78 | $ | 1.31 | |||||||
| Expense and (income) adjustments before income tax items: | |||||||||||||||
| Amortization of certain intangible assets | 0.43 | 0.37 | 0.82 | 0.73 | |||||||||||
| Stock-based compensation | 0.20 | 0.20 | 0.39 | 0.36 | |||||||||||
| Mergers and acquisitions, divestitures and business optimization 1 | (0.01 | ) | (0.02 | ) | (1.20 | ) | 0.07 | ||||||||
| Accelerated technology investment 2 | — | 0.12 | — | 0.22 | |||||||||||
| Operating model optimization program 3 | — | 0.03 | — | 0.08 | |||||||||||
| Net other 4 | — | (0.01 | ) | 0.01 | (0.30 | ) | |||||||||
| Total adjustments before income tax items | $ | 0.62 | $ | 0.69 | $ | 0.02 | $ | 1.16 | |||||||
| Total adjustments for income taxes 5 | (0.13 | ) | (0.16 | ) | (0.39 | ) | (0.33 | ) | |||||||
| Adjusted Diluted Earnings per Share | $ | 1.23 | $ | 1.08 | $ | 2.41 | $ | 2.13 | |||||||
Each component of earnings per share is calculated independently, therefore, rounding differences exist in the table above.
1. Mergers and acquisitions, divestitures and business optimization consisted of the following adjustments:
|
Three Months Ended
June 30, |
Six Months Ended
June 30, |
||||||||||||||
| 2026 | 2025 | 2026 | 2025 | ||||||||||||
| Transaction and integration costs | $ | (0.9 | ) | $ | 2.9 | $ | 7.6 | $ | 8.2 | ||||||
| Fair value and impairment adjustments | (0.3 | ) | (7.6 | ) | (241.2 | ) | 5.0 | ||||||||
| Total mergers and acquisitions, divestitures and business optimization | $ | (1.3 | ) | $ | (4.6 | ) | $ | (233.6 | ) | $ | 13.2 | ||||
For the six months ended June 30, 2026, fair value and impairment adjustments includes the gain on our acquisition of Trans Union de Mexico.
2. Represents expenses associated with our accelerated technology investment to migrate to the cloud. There are three components of the accelerated technology investment: (i) building foundational capabilities which includes establishing a modern, API-based and services-oriented software architecture, (ii) the migration of each application and customer data to the new enterprise platform, including the redundant software costs during the migration period, as well as the efforts to decommission the legacy system, and (iii) program enablement, which includes dedicated resources to support the planning and execution of the program. The amounts for each category of cost are as follows:
|
Three Months Ended
June 30, |
Six Months Ended
June 30, |
||||||
| 2025 | 2025 | ||||||
| Foundational Capabilities | $ | 4.2 | $ | 11.7 | |||
| Migration Management | 19.0 | 31.6 | |||||
| Total accelerated technology investment | $ | 23.2 | $ | 43.3 | |||
3. Operating model optimization consisted of the following adjustments:
| Three Months Ended June 30, | Six Months Ended June 30, | ||||||
| 2025 | 2025 | ||||||
| Business process optimization | $ | 5.4 | $ | 15.2 | |||
| Total operating model optimization | $ | 5.4 | $ | 15.2 | |||
4. Net other consisted of the following adjustments:
| Three Months Ended June 30, | Six Months Ended June 30, | ||||||||||||||
| 2026 | 2025 | 2026 | 2025 | ||||||||||||
| Deferred loan fee expense from debt prepayments and refinancing | $ | — | $ | — | $ | — | $ | (0.1 | ) | ||||||
| Currency remeasurement on foreign operations | (0.5 | ) | (1.5 | ) | 1.1 | (2.1 | ) | ||||||||
| Legal and regulatory expenses, net | — | — | — | (56.0 | ) | ||||||||||
| Total other adjustments | $ | (0.5 | ) | $ | (1.5 | ) | $ | 1.1 | $ | (58.2 | ) | ||||
5. Total adjustments for income taxes represents the total of adjustments discussed to calculate the Adjusted Provision for Income Taxes.
|
SCHEDULE 4
TRANSUNION AND SUBSIDIARIES Adjusted Provision for Income Taxes, Effective Tax Rate and Adjusted Effective Tax Rate (Unaudited) (dollars in millions) |
|||||||||||||||
| Three Months Ended June 30, | Six Months Ended June 30, | ||||||||||||||
| 2026 | 2025 | 2026 | 2025 | ||||||||||||
| Income before income taxes | $ | 201.5 | $ | 156.8 | $ | 629.6 | $ | 350.5 | |||||||
| Total adjustments before income tax items from Schedule 3 | 120.3 | 135.6 | 3.6 | 227.9 | |||||||||||
| Adjusted income before income taxes | $ | 321.8 | $ | 292.4 | $ | 633.2 | $ | 578.5 | |||||||
| Reconciliation of Provision for income taxes to Adjusted Provision for Income Taxes | |||||||||||||||
| Provision for income taxes | $ | (54.8 | ) | $ | (44.4 | ) | $ | (82.4 | ) | $ | (85.4 | ) | |||
| (Expense) and benefit adjustments for income taxes: | |||||||||||||||
| Tax effect of above adjustments | (26.5 | ) | (33.0 | ) | (52.9 | ) | (65.3 | ) | |||||||
| Eliminate impact of excess tax expense (benefit) for stock-based compensation | 0.7 | (0.2 | ) | (0.2 | ) | 0.3 | |||||||||
| Other 1 | (0.3 | ) | 1.1 | (23.2 | ) | 0.2 | |||||||||
| Total adjustments for income taxes | $ | (26.1 | ) | $ | (32.1 | ) | $ | (76.3 | ) | $ | (64.8 | ) | |||
| Adjusted Provision for Income Taxes | $ | (80.9 | ) | $ | (76.5 | ) | $ | (158.7 | ) | $ | (150.3 | ) | |||
| Effective tax rate | 27.2 | % | 28.3 | % | 13.1 | % | 24.4 | % | |||||||
| Adjusted Effective Tax Rate | 25.1 | % | 26.2 | % | 25.1 | % | 26.0 | % | |||||||
As a result of displaying amounts in millions, rounding differences may exist in the table above.
1. Other adjustments for income taxes include:
| Three Months Ended June 30, | Six Months Ended June 30, | ||||||||||||||
| 2026 | 2025 | 2026 | 2025 | ||||||||||||
| Deferred tax adjustments | $ | 0.9 | $ | (2.9 | ) | $ | (18.0 | ) | $ | (7.4 | ) | ||||
| Valuation allowance adjustments | (2.6 | ) | (0.7 | ) | (7.7 | ) | 1.5 | ||||||||
| Return to provision, audit adjustments and reserves related to prior periods | 1.5 | 3.9 | 1.7 | 4.9 | |||||||||||
| Other adjustments | — | 0.8 | 0.9 | 1.2 | |||||||||||
| Total other adjustments | $ | (0.3 | ) | $ | 1.1 | $ | (23.2 | ) | $ | 0.2 | |||||
|
SCHEDULE 5
TRANSUNION AND SUBSIDIARIES Leverage Ratio (Unaudited) (dollars in millions) |
||||
|
Trailing Twelve Months Ended
June 30, 2026 |
||||
| Reconciliation of Net income attributable to TransUnion to Consolidated Adjusted EBITDA: | ||||
| Net income attributable to TransUnion | $ | 738.2 | ||
| Net interest expense | 221.8 | |||
| Provision for income taxes | 170.1 | |||
| Depreciation and amortization | 606.0 | |||
| EBITDA | $ | 1,736.2 | ||
| Expense and (income) adjustments to EBITDA: | ||||
| Stock-based compensation | $ | 151.7 | ||
| Mergers and acquisitions, divestitures and business optimization 1 | (216.8 | ) | ||
| Accelerated technology investment 2 | 41.2 | |||
| Operating model optimization program 3 | 17.1 | |||
| Net other 4 | 6.4 | |||
| Total adjustments to EBITDA | $ | (0.4 | ) | |
| Consolidated Adjusted EBITDA | 1,735.8 | |||
| Adjusted EBITDA for Pre-Acquisition Period 5 | 55.5 | |||
| Leverage Ratio Adjusted EBITDA | $ | 1,791.3 | ||
| Total debt | $ | 5,585.3 | ||
| Less: Cash and cash equivalents | 839.1 | |||
| Net Debt | $ | 4,746.2 | ||
| Ratio of Net Debt to Net income attributable to TransUnion | 6.4 | |||
| Leverage Ratio 6 | 2.6 | |||
As a result of displaying amounts in millions, rounding differences may exist in the table above.
1. Mergers and acquisitions, divestitures and business optimization consisted of the following adjustments:
|
Trailing Twelve Months Ended
June 30, 2026 |
||||
| Transaction and integration costs | $ | 13.3 | ||
| Fair value and impairment adjustments | (229.4 | ) | ||
| Post-acquisition adjustments | (0.7 | ) | ||
| Total mergers and acquisitions, divestitures and business optimization | $ | (216.8 | ) | |
Fair value and impairment adjustments includes the gain on our acquisition of Trans Union de Mexico.
2. Represents expenses associated with our accelerated technology investment to migrate to the cloud. There are three components of the accelerated technology investment: (i) building foundational capabilities which includes establishing a modern, API-based and services-oriented software architecture, (ii) the migration of each application and customer data to the new enterprise platform, including the redundant software costs during the migration period, as well as the efforts to decommission the legacy system, and (iii) program enablement, which includes dedicated resources to support the planning and execution of the program. The amounts for each category of cost are as follows:
|
Trailing Twelve Months Ended
June 30, 2026 |
||||
| Foundational Capabilities | $ | 7.1 | ||
| Migration Management | 34.1 | |||
| Total accelerated technology investment | $ | 41.2 | ||
3. Operating model optimization consisted of the following adjustments:
|
Trailing Twelve Months Ended
June 30, 2026 |
||||
| Employee separation | $ | 6.8 | ||
| Business process optimization | 10.2 | |||
| Total operating model optimization | $ | 17.1 | ||
4. Net other consisted of the following adjustments:
|
Trailing Twelve Months Ended
June 30, 2026 |
||||
| Other debt financing expenses | $ | 1.9 | ||
| Currency remeasurement on foreign operations | 3.7 | |||
| Other non-operating (income) and expense | 0.8 | |||
| Total other adjustments | $ | 6.4 | ||
5. The trailing twelve months ended June 30, 2026 include Adjusted EBITDA related to Trans Union de Mexico and the mobile division of RealNetworks prior to our acquisitions in March 2026 and April 2026, respectively.
6. We define Leverage Ratio as net debt divided by Leverage Ratio Adjusted EBITDA as shown in the table above.
|
SCHEDULE 6
TRANSUNION AND SUBSIDIARIES Segment Depreciation and Amortization (Unaudited) (in millions) |
|||||||||||||||
| Three Months Ended June 30, | Six Months Ended June 30, | ||||||||||||||
| 2026 | 2025 | 2026 | 2025 | ||||||||||||
| U.S. Markets | $ | 108.7 | $ | 105.2 | $ | 217.3 | $ | 206.4 | |||||||
| International | 50.9 | 36.6 | 93.8 | 73.2 | |||||||||||
| Corporate | 0.9 | 0.9 | 1.8 | 2.0 | |||||||||||
| Total depreciation and amortization | $ | 160.5 | $ | 142.7 | $ | 312.9 | $ | 281.6 | |||||||
As a result of displaying amounts in millions, rounding differences may exist in the table above.
|
SCHEDULE 7
TRANSUNION AND SUBSIDIARIES Reconciliation of Non-GAAP Guidance (Unaudited) (in millions, except per share data) |
|||||||||||||||
|
Three Months Ended
September 30, 2026 |
Twelve Months Ended
December 31, 2026 |
||||||||||||||
| Low | High | Low | High | ||||||||||||
| Guidance reconciliation of Net income attributable to TransUnion to Adjusted EBITDA: | |||||||||||||||
| Net income attributable to TransUnion | $ | 132 | $ | 138 | $ | 807 | $ | 821 | |||||||
| Interest, taxes and depreciation and amortization | 279 | 281 | 1,071 | 1,076 | |||||||||||
| EBITDA | $ | 411 | $ | 419 | $ | 1,878 | $ | 1,898 | |||||||
| Stock-based compensation, mergers, acquisitions divestitures and business optimization-related expenses and other adjustments 1 | 44 | 44 | (71 | ) | (71 | ) | |||||||||
| Adjusted EBITDA | $ | 455 | $ | 463 | $ | 1,807 | $ | 1,827 | |||||||
| Net income attributable to TransUnion margin | 10.2 | % | 10.5 | % | 15.7 | % | 15.9 | % | |||||||
| Consolidated Adjusted EBITDA margin 2 | 35.2 | % | 35.4 | % | 35.2 | % | 35.4 | % | |||||||
| Guidance reconciliation of Diluted earnings per share to Adjusted Diluted Earnings per Share: | |||||||||||||||
| Diluted earnings per share | $ | 0.68 | $ | 0.71 | $ | 4.15 | $ | 4.22 | |||||||
| Adjustments to diluted earnings per share 1 | 0.50 | 0.50 | 0.61 | 0.61 | |||||||||||
| Adjusted Diluted Earnings per Share | $ | 1.18 | $ | 1.21 | $ | 4.75 | $ | 4.83 | |||||||
As a result of displaying amounts in millions, rounding differences may exist in the table above.
1. These adjustments include the same adjustments we make to our Adjusted EBITDA and Adjusted Net Income as discussed in the Non-GAAP Financial Measures section of our Earnings Release.
2. Consolidated Adjusted EBITDA margin is calculated by dividing Consolidated Adjusted EBITDA by total revenue.