

Surgery Partners reported Q2 2026 revenue growth of 2.7%, with a net loss of $15 million and reaffirmed full-year guidance.
Quiver AI Summary
Surgery Partners, Inc. reported a revenue increase of 2.7% to $848.9 million for the second quarter of 2026 compared to the previous year, with same-facility revenues rising 5.0%. Despite these gains, the company recorded a net loss of $15.0 million. Adjusted EBITDA fell to $125.2 million, down from $129.0 million in the prior year. Year-to-date revenues also showed an increase of 3.6%, totaling $1.66 billion. The company reaffirmed its full-year revenue guidance, expecting between $3.35 billion and $3.45 billion. CEO Eric Evans expressed optimism about strategic initiatives, including a pending transaction in Idaho Falls aimed at optimizing the company's portfolio and improving financial profiles. CFO Dave Doherty noted that ongoing performance improvement initiatives were positively reflected in the financial results.
Potential Positives
- Revenue increased 2.7% year-over-year to $848.9 million for the second quarter, indicating growth in business operations.
- Same-facility revenues rose 5.0% year-over-year, demonstrating improved performance in existing locations.
- The Company reaffirmed its full-year 2026 revenue guidance in the range of $3.35 billion to $3.45 billion, showing confidence in future performance.
- Adjusted EBITDA for the second quarter was substantial at $125.2 million, reflecting strong operational performance despite a net loss, indicating effective cost management strategies.
Potential Negatives
- Net loss attributable to Surgery Partners, Inc. increased significantly to $15.0 million for the second quarter, up from a loss of $2.5 million in the same period last year, indicating potential financial instability.
- Adjusted EBITDA decreased to $125.2 million from $129.0 million year-over-year, suggesting a decline in operational profitability despite a modest increase in revenue.
- Cash flows from operating activities decreased to $59.3 million in the second quarter, down from $81.3 million in the prior year, which may raise concerns about the company's liquidity and cash generation capabilities.
FAQ
What were the revenue highlights for Surgery Partners in Q2 2026?
Revenue increased by 2.7% to $848.9 million compared to Q2 2025.
How did Same-facility revenues perform in Q2 2026?
Same-facility revenues increased by 5.0% compared to the same period last year.
What is Surgery Partners' adjusted EBITDA for Q2 2026?
The adjusted EBITDA for Q2 2026 was $125.2 million.
What guidance has Surgery Partners provided for 2026?
Full-year 2026 revenue guidance is between $3.35 billion and $3.45 billion.
When is Surgery Partners' conference call for Q2 results?
The conference call is scheduled for August 10, 2026, at 8:30 a.m. Eastern Time.
Disclaimer: This is an AI-generated summary of a press release distributed by GlobeNewswire. The model used to summarize this release may make mistakes. See the full release here.
$SGRY Insider Trading Activity
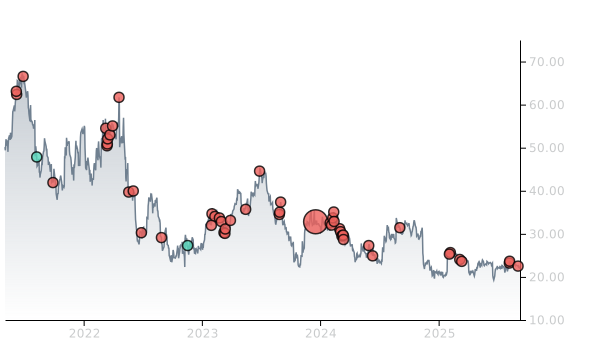
$SGRY insiders have traded $SGRY stock on the open market 12 times in the past 6 months. Of those trades, 0 have been purchases and 12 have been sales.
Here’s a breakdown of recent trading of $SGRY stock by insiders over the last 6 months:
- JASON ERIC EVANS (Chief Executive Officer) has made 0 purchases and 2 sales selling 31,862 shares for an estimated $412,448.
- DAVID T DOHERTY (Chief Financial Officer) has made 0 purchases and 2 sales selling 23,441 shares for an estimated $312,541.
- JENNIFER BALDOCK (Chief Admin & Dev Officer) has made 0 purchases and 2 sales selling 15,880 shares for an estimated $214,483.
- MARISSA BRITTENHAM (Chief Strategy Officer) has made 0 purchases and 2 sales selling 12,442 shares for an estimated $166,213.
- DANIELLE BURKHALTER (Chief Human Resources Officer) has made 0 purchases and 2 sales selling 11,205 shares for an estimated $149,716.
- WILLIAM TRENTON WEBB (American Group President) has made 0 purchases and 2 sales selling 2,066 shares for an estimated $28,653.
To track insider transactions, check out Quiver Quantitative's insider trading dashboard. You can access data on insider stock transactions through the Quiver Quantitative API insider transaction endpoint.
$SGRY Revenue
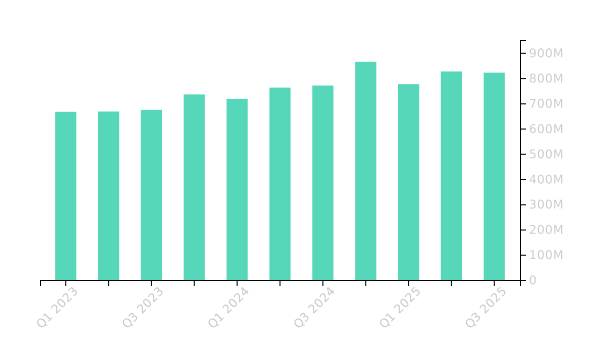
$SGRY had revenues of $821.5M in Q3 2025. This is an increase of 6.63% from the same period in the prior year.
You can track SGRY financials on Quiver Quantitative's SGRY stock page.
You can access data on SGRY stock through the Quiver Quantitative API.
$SGRY Hedge Fund Activity
We have seen 102 institutional investors add shares of $SGRY stock to their portfolio, and 74 decrease their positions in their most recent quarter.
Here are some of the largest recent moves:
- FMR LLC removed 4,383,551 shares (-66.7%) from their portfolio in Q1 2026, for an estimated $52,251,927
- UBS GROUP AG added 2,387,807 shares (+30.6%) to their portfolio in Q1 2026, for an estimated $28,462,659
- NOMURA HOLDINGS INC removed 996,919 shares (-58.0%) from their portfolio in Q1 2026, for an estimated $11,883,274
- DAVIDSON KEMPNER CAPITAL MANAGEMENT LP added 965,000 shares (+40.7%) to their portfolio in Q1 2026, for an estimated $11,502,800
- VARDE MANAGEMENT, L.P. added 755,438 shares (+inf%) to their portfolio in Q1 2026, for an estimated $9,004,820
- GLENVIEW CAPITAL MANAGEMENT, LLC removed 746,735 shares (-29.3%) from their portfolio in Q1 2026, for an estimated $8,901,081
- LMR PARTNERS LLP added 739,685 shares (+205.3%) to their portfolio in Q1 2026, for an estimated $8,817,045
To track hedge funds' stock portfolios, check out Quiver Quantitative's institutional holdings dashboard. You can access data on hedge funds moves and 13F filings through the Quiver Quantitative API 13F endpoint.
$SGRY Price Targets
Multiple analysts have issued price targets for $SGRY recently. We have seen 5 analysts offer price targets for $SGRY in the last 6 months, with a median target of $20.0.
Here are some recent targets:
- Ann Hynes from Mizuho set a target price of $17.0 on 03/05/2026
- A.J. Rice from UBS set a target price of $21.0 on 03/05/2026
- Ryan Langston from TD Cowen set a target price of $20.0 on 03/05/2026
- Ben Hendrix from RBC Capital set a target price of $20.0 on 03/04/2026
- Andrew Mok from Barclays set a target price of $14.0 on 03/03/2026
Full Release
BRENTWOOD, Tenn., Aug. 10, 2026 (GLOBE NEWSWIRE) -- Surgery Partners, Inc. (NASDAQ:SGRY) (“Surgery Partners” or the “Company”), a leading short-stay surgical facility owner and operator, today announced results for the second quarter ended June 30, 2026.
Second Quarter 2026 Financial Highlights
(All comparisons are year-over-year unless otherwise noted)
-
Revenue increased 2.7% for the second quarter
- Same-facility revenues increased 5.0% for the second quarter
- Same-facility cases increased 0.3% for the second quarter
-
Net loss attributable to Surgery Partners, Inc. was $15.0 million for the second quarter
- Adjusted EBITDA was $125.2 million for the second quarter
2026 Guidance
- Full year 2026 revenue guidance reaffirmed to be in the range of $3.35 billion to $3.45 billion and Adjusted EBITDA of at least $530 million, excluding recently disclosed pending divestiture
Eric Evans, Chief Executive Officer, stated, “We are pleased with our progress this quarter, which reflects disciplined execution against our key strategic priorities to support a return to growth and reinforces our conviction in our short stay surgical platform. The announcement of the pending Idaho Falls transaction was a key achievement and represents an important step forward in our portfolio optimization strategy, as we take decisive actions to improve our financial profile and sharpen our strategic focus. Looking ahead, we will capitalize on the structural tailwinds underpinning long-term ASC market growth, enhance operational efficiency, and thoughtfully deploy capital to deliver long-term value for our shareholders.”
Dave Doherty, Chief Financial Officer, commented, “Our financial results in the second quarter demonstrate the momentum of our ongoing initiatives to improve performance, and we are reiterating full-year guidance as a result. The Idaho Falls transaction, which remains subject to closing conditions including physician members and governing board approvals, will further strengthen our financial position, through improved cash conversion and deleveraging. Going forward, we are committed to disciplined capital allocation to support the continued growth of our business.”
Second Quarter 2026 Results
Revenues for the second quarter of 2026 increased 2.7% to $848.9 million compared to $826.2 million for the second quarter of 2025. Same-facility revenues for the second quarter of 2026 increased 5.0% as compared to the same period in prior year, with a 4.8% increase in revenue per case and a 0.3% increase in same-facility cases. For the second quarter of 2026, the Company’s Adjusted EBITDA was $125.2 million, compared to $129.0 million for the same period in 2025.
Year-to-Date 2026 Results
Revenues year-to-date 2026 increased 3.6% to $1,659.8 million compared to $1,602.2 million for the 2025 period. Same-facility revenues for year-to-date 2026 increased 4.9% as compared to the prior year, with a 4.0% increase in revenue per case and a 0.8% increase in same-facility cases. For year-to-date 2026, the Company’s Adjusted EBITDA was $227.5 million, compared to $232.9 million for the same period last year.
Liquidity
Surgery Partners had cash and cash equivalents of $216.7 million and $617.8 million of borrowing capacity under its revolving credit facility as of June 30, 2026. Cash flows from operating activities were $59.3 million for the second quarter of 2026, compared to $81.3 million for the same period in 2025. Year-to-date, operating cash flows were $71.0 million compared to $87.3 million in the prior year period.
The Company’s ratio of total net debt to EBITDA, as calculated under the Company’s credit agreement, was approximately 4.4x at the end of the second quarter of 2026.
2026 Outlook
The Company reaffirmed its outlook for 2026 revenues to be in the range of $3.35 billion to $3.45 billion and Adjusted EBITDA of at least $530 million, excluding the impact of the recently disclosed pending divestiture of our facilities in Idaho Falls, Idaho.
Conference Call Information
Surgery Partners will hold a conference call today, August 10, 2026 at 8:30 a.m. (Eastern Time). The conference call can be accessed live over the phone by dialing 1-877-451-6152, or for international callers, 1-201-389-0879. A replay will be available three hours after the call and can be accessed by dialing 1-844-512-2921, or for international callers, 1-412-317-6671. The passcode for the live call and the replay is 13761354. The replay will be available until August 24, 2026.
Interested investors and other parties may also listen to a simultaneous webcast of the conference call by logging onto the Investor Relations section of the Company's website at www.surgerypartners.com. The replay will also be available on this same website for a limited time following the call.
To learn more about Surgery Partners, please visit the Company's website at www.surgerypartners.com. Surgery Partners uses its website as a channel of distribution for material Company information. Financial and other material information regarding Surgery Partners is routinely posted on the Company's website and is readily accessible.
About Surgery Partners
Headquartered in Brentwood, Tennessee, Surgery Partners is a leading healthcare services company with a differentiated outpatient delivery model focused on providing high quality, cost effective solutions for surgical and related ancillary care in support of both patients and physicians. Founded in 2004, Surgery Partners is one of the largest and fastest growing surgical services businesses in the country, with more than 200 locations in 30 states, including ambulatory surgery centers, surgical hospitals, multi-specialty physician practices and urgent care facilities. For additional information, visit www.surgerypartners.com.
Forward-Looking Statements
This press release contains forward-looking statements, including those regarding growth, our anticipated operating results for future periods and other similar statements. These statements can be identified by the use of words such as "believes," "anticipates," "expects," "intends," "plans," "continues," "estimates," "predicts," "projects," "forecasts," "may," "could," and similar expressions. All forward-looking statements are based on current expectations and beliefs as of the date of this release and are subject to risks, uncertainties and other factors that may cause actual results to differ materially from the expectations discussed in, or implied by, the forward-looking statements. Many of these factors are beyond our ability to control or predict including, without limitation, the risk that the potential sale transaction of our ownership interests in Mountain View Hospital and Idaho Falls Community Hospital to Intermountain Health may not be completed in a timely manner or at all, including the risk that required physician, regulatory and other approvals and consents are not obtained, are delayed, or are obtained subject to conditions that are not anticipated; the failure to satisfy other closing conditions to the transaction; the possibility that the anticipated benefits of the sale to us are not realized as expected, the potential adverse effect of the announcement or pendency of the transaction on the market price of, or trading in, our securities and on our business relationships, operating results, and business generally, including the ability to retain key personnel; risks related to diverting management's attention from our ongoing business operations; the amount of costs, fees, expenses, and charges related to the sale transaction; potential litigation relating to the transaction that could be instituted against us or our affiliates, officers, or directors, and the effects of any outcomes related thereto; reductions in payments from government health care programs and private insurance payors, such as health maintenance organizations, preferred provider organizations, and other managed care organizations and employers; our ability to contract with private insurance payors; changes in our payor mix or surgical case mix; failure to maintain or develop relationships with physicians on beneficial or favorable terms, or at all; the impact of payor controls designed to reduce the number of surgical procedures; our efforts to integrate operations of acquired or developed businesses and surgical facilities, attract new physician partners, or acquire additional surgical facilities; supply chain issues, including shortages or quality control issues with surgery-related products, equipment and medical supplies; competition for physicians, nurses, strategic relationships, acquisitions and managed care contracts; our ability to attract and retain qualified health care professionals; our ability to enforce non-compete restrictions against our physicians; our ability to manage material liabilities whether known or unknown incurred as a result of acquiring or operating surgical facilities; the impact of future legislation and other health care regulatory reform actions, and the effect of that legislation and other regulatory actions on our business; our ability to comply with current health care laws and regulations; the outcome of legal and regulatory proceedings that have been or may be brought against us; the impact of cybersecurity attacks or intrusions, changes in the regulatory, economic and other conditions of the states where our surgical facilities are located; our indebtedness; the social and economic impact of a pandemic, epidemic or outbreak of a contagious disease on our business; and the risks and uncertainties identified and discussed from time to time in the Company’s reports filed with the Securities and Exchange Commission (the "SEC"), including in Item 1A under the heading "Risk Factors" in the Company’s Annual Report on Form 10-K for the year ended December 31, 2025 and other reports filed with the SEC. Except as required by law, the Company undertakes no obligation to revise or update publicly any forward-looking statements to reflect events or circumstances after the date of this report, or to reflect the occurrence of unanticipated events or circumstances.
Use of Non-GAAP Financial Measures
In addition to the results prepared in accordance with generally accepted accounting principles in the United States ("GAAP") provided throughout this press release, Surgery Partners has presented the following non-GAAP financial measures: Adjusted net income (loss) attributable to common stockholders, Adjusted net income (loss) per share attributable to common stockholders, Adjusted EBITDA, and Adjusted EBITDA related to unconsolidated affiliates, which exclude various items detailed in the "Reconciliation of Non-GAAP Financial Measures" below.
These non-GAAP financial measures are not intended to replace financial performance measures determined in accordance with GAAP. Rather, they are presented as supplemental measures of the Company's performance that management believes may enhance the evaluation of the Company's ongoing operating results. These non-GAAP financial measures are not presented in accordance with GAAP, and the Company’s computation of these non-GAAP financial measures may vary from similar measures used by other companies. These measures have limitations as an analytical tool and should not be considered in isolation or as a substitute or alternative to revenue, net income or loss, operating income or loss, cash flows from operating activities, total indebtedness or any other measures of operating performance, liquidity or indebtedness derived in accordance with GAAP.
|
SURGERY PARTNERS, INC.
Selected Consolidated Financial Data (Dollars in millions, except per share amounts, shares in thousands) (Unaudited) |
||||||||||||||||
| Three Months Ended June 30, | Six Months Ended June 30, | |||||||||||||||
| 2026 | 2025 | 2026 | 2025 | |||||||||||||
| Revenues | $ | 848.9 | $ | 826.2 | $ | 1,659.8 | $ | 1,602.2 | ||||||||
| Operating expenses: | ||||||||||||||||
| Salaries and benefits | 253.1 | 235.2 | 500.5 | 473.8 | ||||||||||||
| Supplies | 226.8 | 215.0 | 447.0 | 430.8 | ||||||||||||
| Professional and medical fees | 102.8 | 102.1 | 204.1 | 197.4 | ||||||||||||
| Lease expense | 24.2 | 22.9 | 47.2 | 43.7 | ||||||||||||
| Other operating expenses | 51.8 | 55.4 | 110.6 | 99.0 | ||||||||||||
| Cost of revenues | 658.7 | 630.6 | 1,309.4 | 1,244.7 | ||||||||||||
| General and administrative expenses | 36.3 | 36.1 | 75.6 | 72.1 | ||||||||||||
| Depreciation and amortization | 39.3 | 40.3 | 77.8 | 76.6 | ||||||||||||
| Transaction and integration costs | 18.4 | 18.1 | 34.0 | 42.8 | ||||||||||||
| Net (gain) loss on disposals, consolidations and deconsolidations | 2.4 | (3.0 | ) | 6.7 | 3.4 | |||||||||||
| Equity in earnings of unconsolidated affiliates | (6.4 | ) | (5.5 | ) | (10.5 | ) | (11.1 | ) | ||||||||
| Litigation settlements | — | — | 2.5 | 2.2 | ||||||||||||
| Other income, net | (1.9 | ) | (2.1 | ) | (3.6 | ) | (2.1 | ) | ||||||||
| 746.8 | 714.5 | 1,491.9 | 1,428.6 | |||||||||||||
| Operating income | 102.1 | 111.7 | 167.9 | 173.6 | ||||||||||||
| Interest expense, net | (69.8 | ) | (67.9 | ) | (138.9 | ) | (130.1 | ) | ||||||||
| Income (loss) before income taxes | 32.3 | 43.8 | 29.0 | 43.5 | ||||||||||||
| Income tax (expense) benefit | (2.6 | ) | 1.1 | (1.4 | ) | 1.1 | ||||||||||
| Net income (loss) | 29.7 | 44.9 | 27.6 | 44.6 | ||||||||||||
| Less: Net income attributable to non-controlling interests | (44.7 | ) | (47.4 | ) | (78.5 | ) | (84.8 | ) | ||||||||
| Net income (loss) attributable to Surgery Partners, Inc. | $ | (15.0 | ) | $ | (2.5 | ) | $ | (50.9 | ) | $ | (40.2 | ) | ||||
| Net loss per share attributable to common stockholders | ||||||||||||||||
| Basic | $ | (0.12 | ) | $ | (0.02 | ) | $ | (0.40 | ) | $ | (0.32 | ) | ||||
| Diluted (1) | $ | (0.12 | ) | $ | (0.02 | ) | $ | (0.40 | ) | $ | (0.32 | ) | ||||
| Weighted average common shares outstanding | ||||||||||||||||
| Basic | 128,825 | 126,980 | 128,597 | 126,792 | ||||||||||||
| Diluted (1) | 128,825 | 126,980 | 128,597 | 126,792 | ||||||||||||
| (1) The impact of potentially dilutive securities for all periods was not considered because the effect would be anti-dilutive. | ||||||||||||||||
|
SURGERY PARTNERS, INC.
Selected Financial and Operating Data (Dollars in millions, except per case and per share amounts) (Unaudited) |
||||||
|
June 30,
2026 |
December 31,
2025 |
|||||
| Balance Sheet Data (at period end): | ||||||
| Cash and cash equivalents | $ | 216.7 | $ | 239.9 | ||
| Total current assets | 1,126.0 | 1,150.7 | ||||
| Total assets | 8,049.7 | 8,119.7 | ||||
| Current maturities of long-term debt | 102.9 | 99.3 | ||||
| Total current liabilities | 578.5 | 615.5 | ||||
| Long-term debt, less current maturities | 3,648.3 | 3,602.9 | ||||
| Total liabilities | 4,581.3 | 4,592.9 | ||||
| Non-controlling interests—redeemable | 366.7 | 395.5 | ||||
| Total Surgery Partners, Inc. stockholders' equity | 1,670.7 | 1,712.9 | ||||
| Non-controlling interests—non-redeemable | 1,431.0 | 1,418.4 | ||||
| Total stockholders' equity | 3,101.7 | 3,131.3 | ||||
| Three Months Ended June 30, | Six Months Ended June 30, | |||||||||||||||
| 2026 | 2025 | 2026 | 2025 | |||||||||||||
| Cash Flow Data: | ||||||||||||||||
| Net cash provided by (used in): | ||||||||||||||||
| Operating activities | $ | 59.3 | $ | 81.3 | $ | 71.0 | $ | 87.3 | ||||||||
| Investing activities | (19.8 | ) | 2.1 | (33.2 | ) | (74.3 | ) | |||||||||
| Purchases of property and equipment | (21.8 | ) | (23.4 | ) | (37.8 | ) | (46.1 | ) | ||||||||
| Payments for acquisitions, net of cash acquired | 0.1 | (4.0 | ) | (4.1 | ) | (48.0 | ) | |||||||||
| Purchases of equity investments | — | — | — | (3.8 | ) | |||||||||||
| Financing activities | (5.1 | ) | (62.6 | ) | (61.0 | ) | (32.4 | ) | ||||||||
| Distributions to non-controlling interest holders | (45.5 | ) | (54.0 | ) | (103.5 | ) | (116.3 | ) | ||||||||
| Three Months Ended June 30, | Six Months Ended June 30, | |||||||||||||||
| 2026 | 2025 | 2026 | 2025 | |||||||||||||
| Other Data: | ||||||||||||||||
| Number of surgical facilities as of the end of period | 178 | 162 | 178 | 162 | ||||||||||||
| Number of consolidated surgical facilities as of the end of period | 120 | 115 | 120 | 115 | ||||||||||||
| Cases | 167,866 | 172,858 | 325,577 | 333,158 | ||||||||||||
| Revenue per case | $ | 5,057 | $ | 4,780 | $ | 5,098 | $ | 4,809 | ||||||||
| Adjusted EBITDA (1) | $ | 125.2 | $ | 129.0 | $ | 227.5 | $ | 232.9 | ||||||||
| Adjusted EBITDA margin (2) | 14.7 | % | 15.6 | % | 13.7 | % | 14.5 | % | ||||||||
| Adjusted net income per share attributable to common stockholders - Basic (1) | $ | 0.10 | $ | 0.17 | $ | 0.07 | $ | 0.22 | ||||||||
| Adjusted net income per share attributable to common stockholders - Diluted (1) | $ | 0.10 | $ | 0.17 | $ | 0.07 | $ | 0.21 | ||||||||
| (1) A reconciliation of these non-GAAP financial measures appears below. | ||||||||||||||||
| (2) Defined as Adjusted EBITDA as a % of Revenues. | ||||||||||||||||
|
SURGERY PARTNERS, INC.
Supplemental Information (Dollars in millions, except per case amounts) (Unaudited) |
||||||||||||||
| Three Months Ended June 30, | Six Months Ended June 30, | |||||||||||||
| 2026 | 2025 | 2026 | 2025 | |||||||||||
| Same-facility Information (1) : | ||||||||||||||
| Cases | 197,078 | 196,552 | 370,774 | 367,759 | ||||||||||
| Case growth | 0.3 | % | N/A | 0.8 | % | N/A | ||||||||
| Revenue per case | $ | 4,898 | $ | 4,676 | $ | 5,029 | $ | 4,834 | ||||||
| Revenue per case growth | 4.8 | % | N/A | 4.0 | % | N/A | ||||||||
| Number of work days in the period | 64 | 64 | 127 | 127 | ||||||||||
| Case growth (days adjusted) | 0.3 | % | N/A | 0.8 | % | N/A | ||||||||
| Revenue growth (days adjusted) | 5.0 | % | N/A | 4.9 | % | N/A | ||||||||
| (1) Same-facility information includes cases and revenues from our consolidated and non-consolidated surgical facilities (excluding facilities acquired in new markets or divested during the current and prior periods). | ||||||||||||||
|
SURGERY PARTNERS, INC.
Reconciliation of Non-GAAP Financial Measures (Dollars in millions, except per share amounts, shares in thousands) (Unaudited) |
||||||||||||||||
|
The following table reconciles Adjusted EBITDA to income before income taxes in the reported consolidated financial information, the most directly comparable GAAP financial measure:
|
||||||||||||||||
| Three Months Ended June 30, | Six Months Ended June 30, | |||||||||||||||
| 2026 | 2025 | 2026 | 2025 | |||||||||||||
| Income (loss) before income taxes | $ | 32.3 | $ | 43.8 | $ | 29.0 | $ | 43.5 | ||||||||
| Net income attributable to non-controlling interests | (44.7 | ) | (47.4 | ) | (78.5 | ) | (84.8 | ) | ||||||||
| Interest expense, net | 69.8 | 67.9 | 138.9 | 130.1 | ||||||||||||
| Depreciation and amortization | 39.3 | 40.3 | 77.8 | 76.6 | ||||||||||||
| Equity-based compensation expense | 3.8 | 6.8 | 9.6 | 14.4 | ||||||||||||
| Transaction and integration costs (1) | 18.4 | 18.1 | 34.0 | 42.8 | ||||||||||||
| De novo start-up costs | 1.2 | 2.1 | 3.1 | 3.7 | ||||||||||||
| Net (gain) loss on disposals, consolidations and deconsolidations | 2.4 | (3.0 | ) | 6.7 | 3.4 | |||||||||||
| Litigation settlements and other litigation costs (2) | 2.7 | 0.4 | 6.9 | 3.2 | ||||||||||||
| Adjusted EBITDA (3) | $ | 125.2 | $ | 129.0 | $ | 227.5 | $ | 232.9 | ||||||||
|
(1)
For the three months ended June 30, 2026, this amount includes due diligence, transaction and integration costs related to acquisitions (both completed and in the pipeline) and divested facilities (collectively “M&A costs”) of $12.5 million and other costs, including severance, IT implementation, revenue cycle standardization of $5.9 million. For the three months ended June 30, 2025, this amount includes M&A costs of $14.1 million and other costs, including severance, IT implementation, revenue cycle standardization of $4.0 million.
For the six months ended June 30, 2026, this amount includes M&A costs of $24.3 million and other costs, including severance, IT implementation, revenue cycle standardization of $9.7 million. For the six months ended June 30, 2025, this amount includes M&A costs of $30.9 million and other costs, including severance, IT implementation, revenue cycle standardization of $11.9 million. |
||||||||||||||||
|
(2)
This amount includes other litigation costs of $2.7 million and $0.4 million for the three months ended June 30, 2026 and 2025, respectively.
This amount includes a litigation settlement loss of $2.5 million and $2.2 million for the six months ended June 30, 2026 and 2025, respectively. This amount also includes other litigation costs of $4.4 million and $1.0 million for the six months ended June 30, 2026 and 2025, respectively. |
||||||||||||||||
| (3) We use Adjusted EBITDA as a measure of financial performance. Adjusted EBITDA is a key measure used by management to assess operating performance, make business decisions and allocate resources. Non-controlling interests represent the interests of third parties, such as physicians, and in some cases, healthcare systems that own an interest in surgical facilities that we consolidate for financial reporting purposes. We believe that it is helpful to investors to present Adjusted EBITDA as defined above because it excludes the portion of net income attributable to these third-party interests and clarifies for investors our portion of Adjusted EBITDA generated by our surgical facilities and other operations. Adjusted EBITDA is not a measurement of financial performance under GAAP and should not be considered in isolation or as a substitute for net income, operating income or any other measure calculated in accordance with GAAP. The items excluded from Adjusted EBITDA are significant components in understanding and evaluating our financial performance. We believe such adjustments are appropriate, as the magnitude and frequency of such items can vary significantly and are not related to the assessment of normal operating performance. Our calculation of Adjusted EBITDA may not be comparable to similarly titled measures reported by other companies. | ||||||||||||||||
The following table provides supplemental information for Adjusted EBITDA related to unconsolidated affiliates:
| Three Months Ended June 30, | Six Months Ended June 30, | ||||||||||
| 2026 | 2025 | 2026 | 2025 | ||||||||
| Adjusted EBITDA related to unconsolidated affiliates: | |||||||||||
| Management fee revenues (1)(2) | $ | 10.5 | $ | 8.6 | $ | 20.5 | $ | 16.8 | |||
| Equity in earnings of unconsolidated affiliates (2) | 6.4 | 5.5 | 10.5 | 11.1 | |||||||
| Plus: | |||||||||||
| Start-up costs related to unconsolidated de novo surgical facilities (3) | 0.6 | 1.1 | 1.8 | 1.4 | |||||||
| Adjusted EBITDA related to unconsolidated affiliates | $ | 17.5 | $ | 15.2 | $ | 32.8 | $ | 29.3 | |||
| (1) Includes management and administrative service fees derived from the non-consolidated facilities that the Company accounts for under the equity method and management of surgical facilities in which it does not own an interest. Management fee revenues are included in Revenues on the Consolidated Statements of Operations. | |||||||||||
| (2) Included as a component of income before income taxes in the Adjusted EBITDA reconciliation table above. | |||||||||||
| (3) Included as a component of de novo start-up costs in the Adjusted EBITDA reconciliation table above. | |||||||||||
From time to time, the Company incurs certain non-recurring gains or losses that are normally non-operational in nature and management does not consider relevant in assessing its ongoing operating performance. When significant, Surgery Partners’ management and the Company's Board of Directors typically exclude these gains or losses when evaluating the Company’s operating performance and in certain instances when evaluating performance for incentive compensation purposes. Additionally, management believes that certain investors and equity analysts exclude these or similar items when evaluating the Company’s current or future operating performance and in making informed investment decisions regarding the Company. Accordingly, the Company provides adjusted net income attributable to common stockholders and adjusted net income per share attributable to common stockholders as supplements to the comparable GAAP financial measures. Adjusted net income attributable to common stockholders and adjusted net income per share attributable to common stockholders should not be considered measures of financial performance under GAAP, and the items excluded from such measures are significant components in understanding and assessing financial performance. These measures should not be considered in isolation or as an alternative to the comparable GAAP measures as presented in the consolidated financial statements.
The following table reconciles net income (loss) as reflected in the consolidated statements of operations to adjusted net income attributable to common stockholders used to calculate adjusted net income per share attributable to common stockholders:
| Three Months Ended June 30, | Six Months Ended June 30, | ||||||||||||||
| 2026 | 2025 | 2026 | 2025 | ||||||||||||
| Consolidated Statements of Operations Data: | |||||||||||||||
| Net income (loss) | $ | 29.7 | $ | 44.9 | $ | 27.6 | $ | 44.6 | |||||||
| Plus (minus): | |||||||||||||||
| Net income attributable to non-controlling interests | (44.7 | ) | (47.4 | ) | (78.5 | ) | (84.8 | ) | |||||||
| Equity-based compensation expense | 3.8 | 6.8 | 9.6 | 14.4 | |||||||||||
| Transaction and integration costs | 18.4 | 18.1 | 34.0 | 42.8 | |||||||||||
| De novo start-up costs | 1.2 | 2.1 | 3.1 | 3.7 | |||||||||||
| Net loss on disposals, consolidations and deconsolidations | 2.4 | (3.0 | ) | 6.7 | 3.4 | ||||||||||
| Litigation settlements and other litigation costs | 2.7 | 0.4 | 6.9 | 3.2 | |||||||||||
| Adjusted net income (loss) attributable to common stockholders | $ | 13.5 | $ | 21.9 | $ | 9.4 | $ | 27.3 | |||||||
| Adjusted net income (loss) per share attributable to common stockholders | |||||||||||||||
| Basic | $ | 0.10 | $ | 0.17 | $ | 0.07 | $ | 0.22 | |||||||
| Diluted | $ | 0.10 | $ | 0.17 | $ | 0.07 | $ | 0.21 | |||||||
| Weighted average common shares outstanding | |||||||||||||||
| Basic | 128,825 | 126,980 | 128,597 | 126,792 | |||||||||||
| Diluted | 129,223 | 128,038 | 129,018 | 127,911 | |||||||||||
Contact
Surgery Partners Investor Relations
(615) 234-8940
[email protected]