



NVIDIA reports record revenue of $81.6 billion, with significant growth in Data Center sales and increased shareholder returns.
Quiver AI Summary
NVIDIA reported record revenue of $81.6 billion for the first quarter of fiscal 2027, an increase of 85% year-over-year, driven largely by a 92% rise in Data Center revenue, which totaled $75.2 billion. The company announced an additional $80 billion for share repurchase authorization and raised its quarterly cash dividend from $0.01 to $0.25 per share. The gross margins for the quarter were 74.9% for GAAP and 75.0% for non-GAAP, with diluted earnings per share of $2.39 and $1.87, respectively. CEO Jensen Huang emphasized the rapid advancement of AI infrastructure and NVIDIA's central role in this transformation. The company expects second-quarter revenue to reach around $91 billion, excluding any Data Center compute revenue from China. NVIDIA is also transitioning to a new reporting framework to better reflect its growth in Data Center and Edge Computing markets.
Potential Positives
- Record revenue of $81.6 billion, up 85% from a year ago, indicating strong growth and demand for NVIDIA's products.
- Record Data Center revenue of $75.2 billion, up 92% from a year ago, highlighting the significant expansion in NVIDIA's data center market.
- Announcement of $80.0 billion additional share repurchase authorization, signaling confidence in the company’s future performance and shareholder value enhancement.
- Increase in quarterly cash dividend from $0.01 to $0.25 per share, reflecting a commitment to returning value to shareholders amidst strong financial performance.
Potential Negatives
- Operating expenses increased by 52% year-over-year, indicating rising costs that may affect future profitability.
- NVIDIA's second-quarter outlook excludes any Data Center compute revenue from China, potentially limiting future growth in a significant market.
- There was a substantial loss from equity securities amounting to $15.9 billion, which could indicate volatility and risks in NVIDIA's investment strategy.
FAQ
What were NVIDIA's record revenues for Q1 Fiscal 2027?
NVIDIA reported record revenues of $81.6 billion, up 85% from a year ago.
How much was the share repurchase authorization increased?
NVIDIA announced an additional $80.0 billion in share repurchase authorization.
What is NVIDIA's expected revenue for Q2 Fiscal 2027?
NVIDIA expects revenue of approximately $91.0 billion for Q2 Fiscal 2027.
How much is NVIDIA increasing its quarterly cash dividend?
NVIDIA is increasing its quarterly cash dividend from $0.01 to $0.25 per share.
What new platforms is NVIDIA adopting for its reporting?
NVIDIA is transitioning to report on two market platforms: Data Center and Edge Computing.
Disclaimer: This is an AI-generated summary of a press release distributed by GlobeNewswire. The model used to summarize this release may make mistakes. See the full release here.
$NVDA Insider Trading Activity
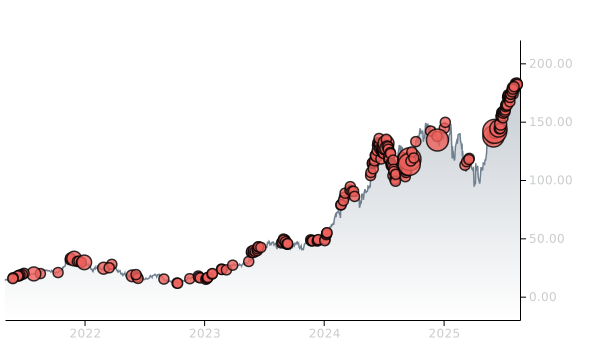
$NVDA insiders have traded $NVDA stock on the open market 140 times in the past 6 months. Of those trades, 0 have been purchases and 140 have been sales.
Here’s a breakdown of recent trading of $NVDA stock by insiders over the last 6 months:
- AJAY K PURI (EVP, Worldwide Field Ops) has made 0 purchases and 9 sales selling 1,000,000 shares for an estimated $183,002,962.
- MARK A STEVENS has made 0 purchases and 4 sales selling 794,182 shares for an estimated $142,193,969.
- DEBORA SHOQUIST (EVP, Operations) has made 0 purchases and 20 sales selling 309,840 shares for an estimated $56,186,171.
- HARVEY C JONES sold 250,000 shares for an estimated $44,333,450
- COLETTE KRESS (EVP & Chief Financial Officer) has made 0 purchases and 84 sales selling 208,430 shares for an estimated $37,132,313.
- DONALD F JR ROBERTSON (Principal Accounting Officer) has made 0 purchases and 16 sales selling 109,986 shares for an estimated $20,556,412.
- AARTI S. SHAH has made 0 purchases and 3 sales selling 19,000 shares for an estimated $3,357,549.
- A BROOKE SEAWELL sold 12,728 shares for an estimated $2,341,117
- JOHN DABIRI has made 0 purchases and 2 sales selling 3,630 shares for an estimated $667,756.
To track insider transactions, check out Quiver Quantitative's insider trading dashboard. You can access data on insider stock transactions through the Quiver Quantitative API insider transaction endpoint.
$NVDA Revenue
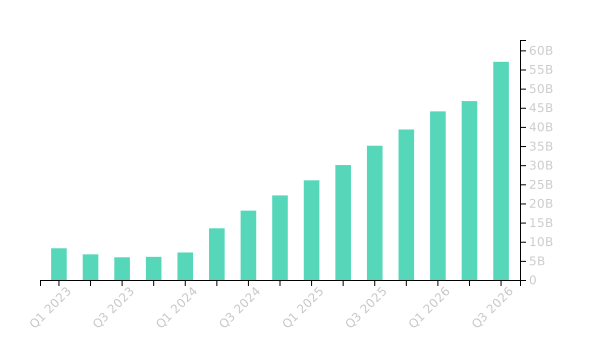
$NVDA had revenues of $57B in Q3 2026. This is an increase of 62.49% from the same period in the prior year.
You can track NVDA financials on Quiver Quantitative's NVDA stock page.
You can access data on NVDA stock through the Quiver Quantitative API.
$NVDA Congressional Stock Trading
Members of Congress have traded $NVDA stock 21 times in the past 6 months. Of those trades, 8 have been purchases and 13 have been sales.
Here’s a breakdown of recent trading of $NVDA stock by members of Congress over the last 6 months:
- REPRESENTATIVE JOHN MCGUIRE has traded it 2 times. They made 2 purchases worth up to $30,000 on 04/15, 01/30 and 0 sales.
- REPRESENTATIVE GILBERT RAY CISNEROS, JR. has traded it 6 times. They made 2 purchases worth up to $30,000 on 03/13, 01/30 and 4 sales worth up to $95,000 on 04/14, 03/25, 12/24, 12/19.
- REPRESENTATIVE LIZZIE FLETCHER sold up to $15,000 on 04/08.
- REPRESENTATIVE DANIEL MEUSER has traded it 4 times. They made 0 purchases and 4 sales worth up to $60,000 on 03/25, 02/25, 01/30, 01/14.
- REPRESENTATIVE TIM MOORE sold up to $50,000 on 03/24.
- SENATOR JOHN BOOZMAN purchased up to $15,000 on 03/19.
- REPRESENTATIVE NANCY PELOSI has traded it 2 times. They made 1 purchase worth up to $500,000 on 01/16 and 1 sale worth up to $5,000,000 on 12/24.
- SENATOR SHELDON WHITEHOUSE has traded it 2 times. They made 0 purchases and 2 sales worth up to $30,000 on 01/09.
- SENATOR MARKWAYNE MULLIN purchased up to $250,000 on 12/29.
- REPRESENTATIVE DWIGHT EVANS purchased up to $15,000 on 11/21.
To track congressional stock trading, check out Quiver Quantitative's congressional trading dashboard. You can access data on congressional stock trades through the Quiver Quantitative API Congress trades endpoint.
$NVDA Hedge Fund Activity
We have seen 2,917 institutional investors add shares of $NVDA stock to their portfolio, and 2,615 decrease their positions in their most recent quarter.
Here are some of the largest recent moves:
- J. STERN & CO. LLP removed 125,140,953 shares (-99.5%) from their portfolio in Q1 2026, for an estimated $21,389,091,686
- CARDANO RISK MANAGEMENT B.V. removed 70,049,522 shares (-89.7%) from their portfolio in Q1 2026, for an estimated $11,972,864,300
- VANGUARD GROUP INC added 43,149,475 shares (+1.9%) to their portfolio in Q4 2025, for an estimated $8,047,377,087
- SG AMERICAS SECURITIES, LLC removed 37,810,007 shares (-100.0%) from their portfolio in Q1 2026, for an estimated $6,462,486,396
- JPMORGAN CHASE & CO removed 32,478,144 shares (-6.6%) from their portfolio in Q4 2025, for an estimated $6,057,173,856
- SOFTBANK GROUP CORP. removed 32,110,456 shares (-100.0%) from their portfolio in Q4 2025, for an estimated $5,988,600,044
- FMR LLC added 22,789,685 shares (+2.3%) to their portfolio in Q1 2026, for an estimated $3,895,212,960
To track hedge funds' stock portfolios, check out Quiver Quantitative's institutional holdings dashboard. You can access data on hedge funds moves and 13F filings through the Quiver Quantitative API 13F endpoint.
$NVDA Analyst Ratings
Wall Street analysts have issued reports on $NVDA in the last several months. We have seen 11 firms issue buy ratings on the stock, and 0 firms issue sell ratings.
Here are some recent analyst ratings:
- Benchmark issued a "Buy" rating on 03/31/2026
- Needham issued a "Buy" rating on 02/18/2026
- RBC Capital issued a "Outperform" rating on 01/15/2026
- Mizuho issued a "Outperform" rating on 01/09/2026
- Stifel issued a "Buy" rating on 12/29/2025
- Truist Securities issued a "Buy" rating on 12/29/2025
- Bernstein issued a "Outperform" rating on 12/26/2025
To track analyst ratings and price targets for $NVDA, check out Quiver Quantitative's $NVDA forecast page.
$NVDA Price Targets
Multiple analysts have issued price targets for $NVDA recently. We have seen 25 analysts offer price targets for $NVDA in the last 6 months, with a median target of $287.0.
Here are some recent targets:
- Frank Lee from HSBC set a target price of $325.0 on 05/19/2026
- Gil Luria from DA Davidson set a target price of $300.0 on 05/18/2026
- Matt Bryson from Wedbush set a target price of $300.0 on 05/18/2026
- Joseph Moore from Morgan Stanley set a target price of $285.0 on 05/18/2026
- John Vinh from Keybanc set a target price of $300.0 on 05/18/2026
- Joshua Buchalter from TD Cowen set a target price of $275.0 on 05/15/2026
- Timothy Arcuri from UBS set a target price of $275.0 on 05/14/2026
Full Release
- Record revenue of $81.6 billion, up 85% from a year ago
- Record Data Center revenue of $75.2 billion, up 92% from a year ago
-
NVIDIA announces $80.0 billion additional share repurchase authorization and increases its quarterly cash dividend from $0.01 per share to $0.25 per share
SANTA CLARA, Calif., May 20, 2026 (GLOBE NEWSWIRE) -- NVIDIA (NASDAQ: NVDA) today reported record revenue for the first quarter ended April 26, 2026, of $81.6 billion, up 20% from the previous quarter and up 85% from a year ago.
For the quarter, GAAP and non-GAAP gross margins were 74.9% and 75.0%, respectively.
For the quarter, GAAP and non-GAAP earnings per diluted share were $2.39 and $1.87, respectively.
“The buildout of AI factories — the largest infrastructure expansion in human history — is accelerating at extraordinary speed,” said Jensen Huang, founder and CEO of NVIDIA. “Agentic AI has arrived, doing productive work, generating real value and scaling rapidly across companies and industries. NVIDIA is uniquely positioned at the center of this transformation as the only platform that runs in every cloud, powers every frontier and open source model, and scales everywhere AI is produced — from hyperscale data centers to the edge.”
During the first quarter of fiscal 2027, NVIDIA returned a record level of approximately $20.0 billion to shareholders in the form of shares repurchased and cash dividends. As of the end of the first quarter, the company had $38.5 billion remaining under its share repurchase authorization. On May 18, 2026, the Board of Directors approved an additional $80.0 billion to the Company’s share repurchase authorization, without expiration. NVIDIA is increasing its quarterly cash dividend from $0.01 per share to $0.25 per share of common stock, which will be paid on June 26, 2026, to all shareholders of record on June 4, 2026.
NVIDIA is transitioning to a new reporting framework that better reflects its current and future growth drivers. NVIDIA will have two market platforms — Data Center and Edge Computing. Within Data Center, NVIDIA will report two sub-markets, Hyperscale and ACIE, which incorporates AI Clouds, Industrial and Enterprise. Hyperscale will include revenue from the public clouds and the world’s largest consumer internet companies, while ACIE addresses NVIDIA’s growth opportunity in diverse AI purpose-built data centers and AI factories across industries and countries. Edge Computing highlights data processing devices for agentic and physical AI including PCs, game consoles, workstations, AI-RAN base stations, robotics and automotive.
Under the previous sub-markets, Data Center compute revenue was a record $60.4 billion, up 77% from a year ago and up 18% sequentially. Data Center networking revenue was a record $14.8 billion, up 199% from a year ago and up 35% sequentially.
Q1 Fiscal 2027 Summary
| GAAP | |||||
| ($ in millions, except earnings per share) | Q1 FY27 | Q4 FY26 | Q1 FY26 | Q/Q | Y/Y |
| Revenue | $81,615 | $68,127 | $44,062 | 20% | 85% |
| Gross margin | 74.9% | 75.0% | 60.5% | (0.1) pts | 14.4 pts |
| Operating expenses | $7,621 | $6,794 | $5,030 | 12% | 52% |
| Operating income | $53,536 | $44,299 | $21,638 | 21% | 147% |
| Net income | $58,321 | $42,960 | $18,775 | 36% | 211% |
| Diluted earnings per share | $2.39 | $1.76 | $0.76 | 36% | 214% |
| Non-GAAP | |||||
| ($ in millions, except earnings per share) | Q1 FY27 | Q4 FY26 | Q1 FY26 | Q/Q | Y/Y |
| Revenue | $81,615 | $68,127 | $44,062 | 20% | 85% |
| Gross margin | 75.0% | 75.1% | 60.8% | (0.1) pts | 14.2 pts |
| Operating expenses | $7,449 | $6,666 | $4,993 | 12% | 49% |
| Operating income | $53,783 | $44,474 | $21,801 | 21% | 147% |
| Net income | $45,548 | $38,969 | $19,094 | 17% | 139% |
| Diluted earnings per share | $1.87 | $1.59 | $0.78 | 18% | 140% |
Outlook
NVIDIA’s outlook for the second quarter of fiscal 2027 is as follows:
- Revenue is expected to be $91.0 billion, plus or minus 2%. NVIDIA is not assuming any Data Center compute revenue from China in its outlook.
- GAAP and non-GAAP gross margins are expected to be 74.9% and 75.0%, respectively, plus or minus 50 basis points.
-
GAAP and non-GAAP operating expenses are expected to be approximately $8.5 billion and $8.3 billion, respectively.
For the full year fiscal 2027, NVIDIA expects GAAP and non-GAAP tax rates to be between 16.0% and 18.0%, excluding any discrete items and material changes to NVIDIA’s tax environment.
Highlights
Data Center
- First-quarter revenue was a record $75.2 billion, up 21% from the previous quarter and up 92% from a year ago.
- Announced the NVIDIA Vera Rubin platform, including the NVIDIA Vera CPU , the world’s first processor purpose-built for agentic AI, and NVIDIA BlueField ® -4 STX, accelerated storage infrastructure for agentic AI factories.
- Entered production with NVIDIA Dynamo 1.0 , open source software that boosts generative and agentic inference on NVIDIA Blackwell GPUs by up to 7x, with widespread global adoption.
- Announced NVIDIA NemoClaw™ for the OpenClaw agent platform, NVIDIA OpenShell™ with privacy and security controls for autonomous AI agents, and NVIDIA Agent Toolkit , an open source platform for building autonomous enterprise AI agents.
- Advanced open AI model development with new NVIDIA Nemotron™ , NVIDIA BioNeMo™ and NVIDIA Ising models , and the launch of the NVIDIA Nemotron Coalition .
- Expanded collaboration with Google Cloud to advance agentic and physical AI, including new NVIDIA Vera Rubin-powered A5X instances and a preview of Google Gemini models on Google Distributed Cloud running on NVIDIA Blackwell and Blackwell Ultra GPUs.
- Expanded the AI ecosystem through a strategic partnership with Marvell via NVIDIA NVLink Fusion™, and collaboration on silicon photonics technology.
-
Announced multi-year strategic agreements with
Coherent
,
Corning
and
Lumentum
to accelerate innovation in advanced optics technologies.
- Announced the NVIDIA RTX PRO™ 4500 Blackwell Server Edition GPU .
Edge Computing
- First-quarter Edge Computing revenue was $6.4 billion, up 10% from the previous quarter and up 29% from a year ago.
- Released NVIDIA DLSS 4.5 Dynamic Multi Frame Generation and previewed the next generation of DLSS 3D-guided neural rendering model, DLSS 5 , NVIDIA’s most significant graphics breakthrough since ray tracing in 2018.
- Accelerated and optimized key local agentic models, including Gemma 4, Qwen, Mistral and NVIDIA Nemotron for NVIDIA RTX™ and edge devices.
- Announced the NVIDIA Alpamayo 1.5 open model and NVIDIA Omniverse NuRec technologies that enable autonomous driving systems at scale.
- Expanded partnership with Hyundai Motor Company and Kia for next-generation autonomous driving built on the NVIDIA DRIVE Hyperion™ platform, and expanded partnership with Uber to launch a fleet of autonomous vehicles powered by full-stack NVIDIA DRIVE AV software.
- Announced that BYD, Geely, Isuzu and Nissan are building level 4-ready vehicles on the NVIDIA DRIVE Hyperion platform, and introduced NVIDIA Halos OS , a unified safety architecture for AI-driven vehicles.
- Announced new NVIDIA Cosmos™ and NVIDIA Isaac™ GR00T N models, new Isaac simulation frameworks, the general availability of NVIDIA IGX Thor™ and physical AI leaders building on NVIDIA technology.
- Partnered with global industrial software leaders to accelerate AI-driven design, engineering and manufacturing using NVIDIA CUDA-X™ , NVIDIA Omniverse™ and accelerated computing.
-
Announced collaboration with
T-Mobile
and Nokia to integrate physical AI applications on AI-RAN-ready infrastructure, as well as a commitment with
global telecom leaders
to build 6G wireless networks on AI-native, open and secure platforms.
CFO Commentary
Commentary on the quarter by Colette Kress, NVIDIA’s executive vice president and chief financial officer, is available at https://investor.nvidia.com.
Conference Call and Webcast Information
NVIDIA will conduct a conference call with analysts and investors to discuss its first quarter fiscal 2027 financial results and current financial prospects today at 2 p.m. Pacific time (5 p.m. Eastern time). A live webcast (listen-only mode) of the conference call will be accessible at NVIDIA’s investor relations website, https://investor.nvidia.com. The webcast will be recorded and available for replay until NVIDIA’s conference call to discuss its financial results for its second quarter of fiscal 2027.
Non-GAAP Measures
To supplement NVIDIA’s condensed consolidated financial statements presented in accordance with GAAP, the company uses non-GAAP measures of certain components of financial performance. These non-GAAP measures include non-GAAP gross profit, non-GAAP gross margin, non-GAAP operating expenses, non-GAAP operating income, non-GAAP other income (expense), net, non-GAAP net income, non-GAAP net income, or earnings, per diluted share, and free cash flow. For NVIDIA’s investors to be better able to compare its current results with those of previous periods, the company has shown a reconciliation of GAAP to non-GAAP financial measures. These reconciliations adjust the related GAAP financial measures to exclude acquisition-related and other costs, other, gains/losses from equity securities, net, certain other income and expense, and the associated tax impact of these items where applicable. Beginning in the first quarter of fiscal 2027, NVIDIA’s non-GAAP financial measures no longer exclude stock-based compensation expense. The historical non-GAAP financial information presented has been updated to include stock-based compensation expense. Free cash flow is calculated as GAAP net cash provided by operating activities less both purchases related to property and equipment and intangible assets and principal payments on property and equipment and intangible assets. NVIDIA believes the presentation of its non-GAAP financial measures enhances the users’ overall understanding of the company’s historical financial performance. The presentation of the company’s non-GAAP financial measures is not meant to be considered in isolation or as a substitute for the company’s financial results prepared in accordance with GAAP, and the company’s non-GAAP measures may be different from non-GAAP measures used by other companies.
| NVIDIA CORPORATION | |||||||||
| CONDENSED CONSOLIDATED STATEMENTS OF INCOME | |||||||||
| (In millions, except per share data) | |||||||||
| (Unaudited) | |||||||||
| Three Months Ended | |||||||||
| April 26, | April 27, | ||||||||
| 2026 | 2025 | ||||||||
| Revenue | $ | 81,615 | $ | 44,062 | |||||
| Cost of revenue | 20,458 | 17,394 | |||||||
| Gross profit | 61,157 | 26,668 | |||||||
| Operating expenses | |||||||||
| Research and development | 6,321 | 3,989 | |||||||
| Sales, general and administrative | 1,300 | 1,041 | |||||||
| Total operating expenses | 7,621 | 5,030 | |||||||
| Operating income | 53,536 | 21,638 | |||||||
| Interest income | 540 | 515 | |||||||
| Interest expense | (102 | ) | (63 | ) | |||||
| Other income (expense), net | 15,929 | (180 | ) | ||||||
| Total other income, net | 16,367 | 272 | |||||||
| Income before income tax | 69,903 | 21,910 | |||||||
| Income tax expense | 11,582 | 3,135 | |||||||
| Net income | $ | 58,321 | $ | 18,775 | |||||
| Net income per share: | |||||||||
| Basic | $ | 2.40 | $ | 0.77 | |||||
| Diluted | $ | 2.39 | $ | 0.76 | |||||
| Weighted average shares used in per share computation: | |||||||||
| Basic | 24,286 | 24,441 | |||||||
| Diluted | 24,391 | 24,611 | |||||||
| NVIDIA CORPORATION | ||||||||
| CONDENSED CONSOLIDATED BALANCE SHEETS | ||||||||
| (In millions) | ||||||||
| (Unaudited) | ||||||||
| April 26, | January 25, | |||||||
|
2026
|
2026
|
|||||||
| ASSETS | ||||||||
| Current assets: | ||||||||
| Cash and cash equivalents | $ | 13,237 | $ | 10,605 | ||||
| Marketable debt securities | 37,098 | 39,065 | ||||||
| Marketable equity securities | 30,237 | 12,886 | ||||||
| Accounts receivable, net | 40,710 | 38,466 | ||||||
| Inventories | 25,797 | 21,403 | ||||||
| Prepaid expenses and other current assets | 3,916 | 3,180 | ||||||
| Total current assets | 150,995 | 125,605 | ||||||
| Property and equipment, net | 12,403 | 10,383 | ||||||
| Operating lease assets | 4,258 | 2,867 | ||||||
| Goodwill | 20,894 | 20,832 | ||||||
| Intangible assets, net | 3,120 | 3,306 | ||||||
| Deferred income tax assets | 11,707 | 13,258 | ||||||
| Non-marketable securities | 43,364 | 22,251 | ||||||
| Other assets | 12,733 | 8,301 | ||||||
| Total assets | $ | 259,474 | $ | 206,803 | ||||
| LIABILITIES AND SHAREHOLDERS' EQUITY | ||||||||
| Current liabilities: | ||||||||
| Accounts payable | $ | 13,097 | $ | 9,812 | ||||
| Accrued and other current liabilities | 29,787 | 21,352 | ||||||
| Short-term debt | 1,000 | 999 | ||||||
| Total current liabilities | 43,884 | 32,163 | ||||||
| Long-term debt | 7,470 | 7,469 | ||||||
| Long-term operating lease liabilities | 3,878 | 2,572 | ||||||
| Other long-term liabilities | 8,768 | 7,306 | ||||||
| Total liabilities | 64,000 | 49,510 | ||||||
| Shareholders' equity | 195,474 | 157,293 | ||||||
| Total liabilities and shareholders' equity | $ | 259,474 | $ | 206,803 | ||||
| NVIDIA CORPORATION | |||||||||
| CONDENSED CONSOLIDATED STATEMENTS OF CASH FLOWS | |||||||||
| (In millions) | |||||||||
| (Unaudited) | |||||||||
| Three Months Ended | |||||||||
| April 26, | April 27, | ||||||||
| 2026 | 2025 | ||||||||
| Cash flows from operating activities: | |||||||||
| Net income | $ | 58,321 | $ | 18,775 | |||||
| Adjustments to reconcile net income to net cash | |||||||||
| provided by operating activities: | |||||||||
| Stock-based compensation expense | 1,928 | 1,474 | |||||||
| Deferred income taxes | 1,584 | (2,177 | ) | ||||||
| Depreciation and amortization | 997 | 611 | |||||||
| (Gains) losses from equity securities, net | (15,936 | ) | 175 | ||||||
| Other | (94 | ) | (98 | ) | |||||
| Changes in operating assets and liabilities, net of acquisitions: | |||||||||
| Accounts receivable | (2,243 | ) | 933 | ||||||
| Inventories | (4,420 | ) | (1,258 | ) | |||||
| Prepaid expenses and other assets | (983 | ) | 560 | ||||||
| Accounts payable | 2,210 | 941 | |||||||
| Accrued and other current liabilities | 7,763 | 7,128 | |||||||
| Other long-term liabilities | 1,217 | 350 | |||||||
| Net cash provided by operating activities | 50,344 | 27,414 | |||||||
| Cash flows from investing activities: | |||||||||
| Proceeds from maturities of marketable debt securities | 1,946 | 3,122 | |||||||
| Proceeds from sales of non-marketable securities | 26 | - | |||||||
| Proceeds from sales of marketable debt securities | 25 | 467 | |||||||
| Purchases of non-marketable securities | (18,582 | ) | (649 | ) | |||||
| Purchases of marketable debt and equity securities | (8,000 | ) | (6,546 | ) | |||||
| Purchases related to property and equipment and intangible assets | (1,757 | ) | (1,227 | ) | |||||
| Acquisitions, net of cash acquired | (87 | ) | (383 | ) | |||||
| Net cash used in investing activities | (26,429 | ) | (5,216 | ) | |||||
| Cash flows from financing activities: | |||||||||
| Proceeds related to employee stock plans | 515 | 370 | |||||||
| Payments related to repurchases of common stock | (19,312 | ) | (14,095 | ) | |||||
| Payments related to employee stock plan taxes | (2,129 | ) | (1,532 | ) | |||||
| Dividends paid | (243 | ) | (244 | ) | |||||
| Principal payments on property and equipment and intangible assets | (33 | ) | (52 | ) | |||||
| Other | (81 | ) | - | ||||||
| Net cash used in financing activities | (21,283 | ) | (15,553 | ) | |||||
| Change in cash and cash equivalents | 2,632 | 6,645 | |||||||
| Cash and cash equivalents at beginning of period | 10,605 | 8,589 | |||||||
| Cash and cash equivalents at end of period | $ | 13,237 | $ | 15,234 | |||||
| NVIDIA CORPORATION | |||||||||||||
| RECONCILIATION OF GAAP TO NON-GAAP FINANCIAL MEASURES | |||||||||||||
| ($ in millions, except per share data) | |||||||||||||
| (Unaudited) | |||||||||||||
| Three Months Ended | |||||||||||||
| April 26, | January 25, | April 27, | |||||||||||
| 2026 | 2026 | 2025 | |||||||||||
| GAAP cost of revenue | $ | 20,458 | $ | 17,034 | $ | 17,394 | |||||||
| GAAP gross profit | $ | 61,157 | $ | 51,093 | $ | 26,668 | |||||||
| GAAP gross margin | 74.9 | % | 75.0 | % | 60.5 | % | |||||||
| Acquisition-related and other costs (A) | 47 | 48 | 123 | ||||||||||
| Other | 28 | (1 | ) | 3 | |||||||||
| Non-GAAP cost of revenue | $ | 20,383 | $ | 16,987 | $ | 17,268 | |||||||
| Non-GAAP gross profit | $ | 61,232 | $ | 51,140 | $ | 26,794 | |||||||
|
Non-GAAP gross margin*
|
75.0 | % | 75.1 | % | 60.8 | % | |||||||
| GAAP operating expenses | $ | 7,621 | $ | 6,794 | $ | 5,030 | |||||||
| Acquisition-related and other costs (A) | (172 | ) | (90 | ) | (37 | ) | |||||||
| Other | - | (38 | ) | - | |||||||||
| Non-GAAP operating expenses | $ | 7,449 | $ | 6,666 | $ | 4,993 | |||||||
| GAAP operating income | $ | 53,536 | $ | 44,299 | $ | 21,638 | |||||||
| Total impact of non-GAAP adjustments to operating income | 247 | 175 | 163 | ||||||||||
| Non-GAAP operating income* | $ | 53,783 | $ | 44,474 | $ | 21,801 | |||||||
| GAAP total other income, net | $ | 16,367 | $ | 6,098 | $ | 272 | |||||||
| (Gains) losses from equity securities, net | (15,936 | ) | (5,491 | ) | 175 | ||||||||
| Other (B) | 26 | 13 | 1 | ||||||||||
| Non-GAAP total other income, net | $ | 457 | $ | 620 | $ | 448 | |||||||
| GAAP net income | $ | 58,321 | $ | 42,960 | $ | 18,775 | |||||||
| Total pre-tax impact of non-GAAP adjustments | (15,663 | ) | (5,303 | ) | 339 | ||||||||
| Income tax impact of non-GAAP adjustments | 2,890 | 1,312 | (20 | ) | |||||||||
| Non-GAAP net income* | $ | 45,548 | $ | 38,969 | $ | 19,094 | |||||||
| Diluted net income per share | |||||||||||||
| GAAP | $ | 2.39 | $ | 1.76 | $ | 0.76 | |||||||
| Non-GAAP* | $ | 1.87 | $ | 1.59 | $ | 0.78 | |||||||
| Weighted average shares used in diluted net income per share computation | 24,391 | 24,432 | 24,611 | ||||||||||
| GAAP net cash provided by operating activities | $ | 50,344 | $ | 36,190 | $ | 27,414 | |||||||
| Purchases related to property and equipment and intangible assets | (1,757 | ) | (1,284 | ) | (1,227 | ) | |||||||
| Principal payments on property and equipment and intangible assets | (33 | ) | (4 | ) | (52 | ) | |||||||
| Free cash flow | $ | 48,554 | $ | 34,902 | $ | 26,135 | |||||||
| *Includes H20 charges/(releases), net, which was $4.5 billion for the first quarter of fiscal 2026, insignificant for the fourth quarter of fiscal 2026, and none for the first quarter of fiscal 2027. | |||||||||||||
| (A) Acquisition-related and other costs are comprised of amortization of intangible assets, transaction costs, and certain compensation charges and are included in the following line items: | |||||||||||||
| Three Months Ended | |||||||||||||
| April 26, | January 25, | April 27, | |||||||||||
| 2026 | 2026 | 2025 | |||||||||||
| Cost of revenue | $ | 47 | $ | 48 | $ | 123 | |||||||
| Research and development | $ | 167 | $ | 83 | $ | 28 | |||||||
| Sales, general and administrative | $ | 5 | $ | 7 | $ | 9 | |||||||
| (B) Comprised of interest expense related to acquisition consideration discount to be paid in the future, dividend income on equity securities, share of net (earnings)/losses related to equity method investments, and amortization of debt discount. | |||||||||||||
| NVIDIA CORPORATION | ||||
| RECONCILIATION OF GAAP TO NON-GAAP OUTLOOK | ||||
| Q2 FY27 Outlook | ||||
| ($ in millions) | ||||
| GAAP gross margin | 74.9 | % | ||
| Impact of acquisition-related costs and other costs | 0.1 | % | ||
| Non-GAAP gross margin | 75.0 | % | ||
| GAAP operating expenses | $ | 8,500 | ||
| Acquisition-related costs and other costs | (200 | ) | ||
| Non-GAAP operating expenses | $ | 8,300 | ||
About NVIDIA
NVIDIA (NASDAQ: NVDA) is the world leader in AI and accelerated computing.
For further information, contact:
| Toshiya Hari | Mylene Mangalindan | |
| Investor Relations | Corporate Communications | |
| NVIDIA Corporation | NVIDIA Corporation | |
| [email protected] | [email protected] | |
Certain statements in this press release including, but not limited to, statements as to: the buildout of AI factories—the largest infrastructure expansion in human history—accelerating at extraordinary speed; the value generated by agentic AI; expectations with respect to growth, performance and benefits of NVIDIA’s products, services and technologies, including Blackwell, and related trends and drivers; expectations with respect to supply and demand for NVIDIA’s products, services and technologies, including Blackwell, and related matters including inventory, production and distribution; expectations with respect to NVIDIA’s third party arrangements, including with its collaborators and partners; expectations with respect to technology developments, including Vera Rubin, and related trends and drivers; future NVIDIA cash dividends or other returns to stockholders; NVIDIA’s financial and business outlook for the second quarter of fiscal 2027 and beyond; projected market growth and trends; expectations with respect to AI and related industries; and other statements that are not historical facts are forward-looking statements within the meaning of Section 27A of the Securities Act of 1933, as amended, and Section 21E of the Securities Exchange Act of 1934, as amended, which are subject to the “safe harbor” created by those sections based on management’s beliefs and assumptions and on information currently available to management and are subject to risks and uncertainties that could cause results to be materially different than expectations. Important factors that could cause actual results to differ materially include: global economic and political conditions; NVIDIA’s reliance on third parties to manufacture, assemble, package and test NVIDIA’s products; the impact of technological development and competition; development of new products and technologies or enhancements to NVIDIA’s existing products and technologies; market acceptance of NVIDIA’s products or NVIDIA’s partners’ products; design, manufacturing or software defects; changes in consumer preferences or demands; changes in industry standards and interfaces; unexpected loss of performance of NVIDIA’s products or technologies when integrated into systems; NVIDIA’s ability to realize the potential benefits of business investments or acquisitions; and changes in applicable laws and regulations, as well as other factors detailed from time to time in the most recent reports NVIDIA files with the Securities and Exchange Commission, or SEC, including, but not limited to, its Annual Report on Form 10-K and Quarterly Reports on Form 10-Q. Copies of reports filed with the SEC are posted on the company’s website and are available from NVIDIA without charge. These forward-looking statements are not guarantees of future performance and speak only as of the date hereof, and, except as required by law, NVIDIA disclaims any obligation to update these forward-looking statements to reflect future events or circumstances.
© 2026 NVIDIA Corporation. All rights reserved. NVIDIA, the NVIDIA logo, BlueField, Cosmos, NemoClaw, Nemotron, NVIDIA Isaac, BioNeMo, CUDA-X, NVIDIA DRIVE Hyperion, NVIDIA IGX Thor, NVIDIA Omniverse, NVIDIA OpenShell, NVIDIA RTX PRO, NVIDIA RTX, and NVLink Fusion are trademarks and/or registered trademarks of NVIDIA Corporation in the U.S. and/or other countries. Other company and product names may be trademarks of the respective companies with which they are associated. Features, pricing, availability and specifications are subject to change without notice.
A photo accompanying this announcement is available at https://www.globenewswire.com/NewsRoom/AttachmentNg/ef35707a-78bc-4b04-bc35-ff7fad530550