

Kornit Digital reports Q3 2026 revenue of $58.3 million, up 10% YoY; adjusted EBITDA of $2.7 million.
Quiver AI Summary
Kornit Digital Ltd. reported strong financial results for the third quarter of 2026, with total revenue reaching $58.3 million, marking a 10% increase year-over-year and hitting the high end of guidance. The adjusted EBITDA was $2.7 million, exceeding guidance, while the annual recurring revenue (ARR) surged 83% to $39.4 million. Additional noteworthy metrics included a 70% rise in AIC revenue and TCV, with screen customers contributing 60% of systems shipped. The company also celebrated positive operating cash flow for the twelfth consecutive quarter. CEO Ronen Samuel emphasized the shift toward digital manufacturing in the apparel industry and the company's ongoing commitment to align with customer demand to foster sustained growth. For the fourth quarter, Kornit anticipates revenue between $60 million and $65 million, with an adjusted EBITDA margin of 6.5% to 9%.
Potential Positives
- Total revenue reached $58.3 million, marking an approximately 10% increase year-over-year and positioning at the high end of guidance.
- ARR (Annual Recurring Revenue) surged to $39.4 million, reflecting an impressive 83% year-over-year growth, indicating strong customer commitments.
- The company achieved positive operating cash flow for the twelfth consecutive quarter, demonstrating financial stability and effective cash management.
- Adjusted EBITDA rose to $2.7 million, significantly exceeding the previous year's figure and the company's own guidance, suggesting improved profitability.
Potential Negatives
- Despite a revenue increase and positive growth metrics, the company reported a GAAP net loss of $0.4 million for the quarter, indicating ongoing financial challenges.
- The GAAP operating expenses rose to $32.2 million, compared to $31.1 million in the prior year, reflecting increasing costs that may not align with revenue growth.
- Despite improved adjusted EBITDA, the margin remains relatively low at 4.6%, which may raise concerns about the company's profitability and operational efficiency moving forward.
FAQ
What were Kornit Digital's total revenues for Q3 2026?
Kornit Digital reported total revenues of $58.3 million for Q3 2026, up approximately 10% year over year.
How much did AIC revenue increase in Q3 2026?
AIC revenue increased by 70% year over year in Q3 2026.
What was Kornit Digital's adjusted EBITDA for Q3 2026?
Kornit Digital achieved an adjusted EBITDA of $2.7 million for Q3 2026, exceeding guidance.
What is Kornit Digital's ARR at the end of Q3 2026?
The annual recurring revenue (ARR) at the end of Q3 2026 was approximately $39.4 million, an increase of 83% year over year.
When will Kornit Digital host its earnings conference call?
Kornit Digital will host its earnings conference call on November 18, 2026, at 8:30 a.m. ET.
Disclaimer: This is an AI-generated summary of a press release distributed by GlobeNewswire. The model used to summarize this release may make mistakes. See the full release here.
$KRNT Insider Trading Activity
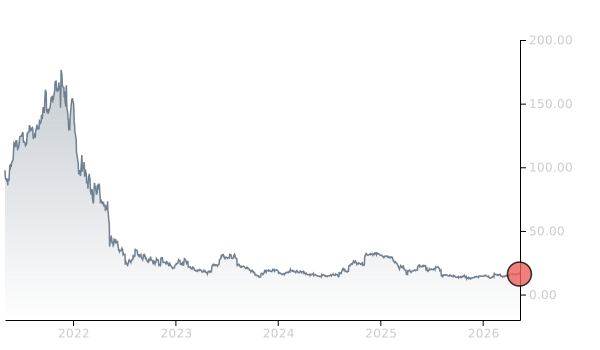
$KRNT insiders have traded $KRNT stock on the open market 17 times in the past 6 months. Of those trades, 0 have been purchases and 17 have been sales.
Here’s a breakdown of recent trading of $KRNT stock by insiders over the last 6 months:
- YAAQOV MANN (Chief Technology Officer) has made 0 purchases and 12 sales selling 100,031 shares for an estimated $1,742,459.
- DANIEL GAZIT (Chief Product Officer) has made 0 purchases and 5 sales selling 3,062 shares for an estimated $55,467.
To track insider transactions, check out Quiver Quantitative's insider trading dashboard. You can access data on insider stock transactions through the Quiver Quantitative API insider transaction endpoint.
$KRNT Hedge Fund Activity
We have seen 70 institutional investors add shares of $KRNT stock to their portfolio, and 80 decrease their positions in their most recent quarter.
Here are some of the largest recent moves:
- ARTISAN PARTNERS LIMITED PARTNERSHIP removed 1,124,269 shares (-37.6%) from their portfolio in Q3 2026, for an estimated $18,685,350
- STEPHENS INVESTMENT MANAGEMENT GROUP LLC removed 809,011 shares (-53.4%) from their portfolio in Q3 2026, for an estimated $13,445,762
- CALIFORNIA STATE TEACHERS RETIREMENT SYSTEM removed 739,141 shares (-94.0%) from their portfolio in Q3 2026, for an estimated $12,284,523
- BNP PARIBAS ASSET MANAGEMENT HOLDING S.A. removed 582,578 shares (-100.0%) from their portfolio in Q2 2026, for an estimated $9,466,892
- POLAR ASSET MANAGEMENT PARTNERS INC. removed 521,734 shares (-100.0%) from their portfolio in Q2 2026, for an estimated $8,478,177
- MILLENNIUM MANAGEMENT LLC removed 470,216 shares (-47.4%) from their portfolio in Q3 2026, for an estimated $7,814,989
- PROSPECT CAPITAL ADVISORS, LLC added 391,150 shares (+inf%) to their portfolio in Q3 2026, for an estimated $6,500,913
To track hedge funds' stock portfolios, check out Quiver Quantitative's institutional holdings dashboard. You can access data on hedge funds moves and 13F filings through the Quiver Quantitative API 13F endpoint.
$KRNT Analyst Ratings
Wall Street analysts have issued reports on $KRNT in the last several months. We have seen 1 firms issue buy ratings on the stock, and 0 firms issue sell ratings.
Here are some recent analyst ratings:
- Needham issued a "Buy" rating on 08/12/2026
To track analyst ratings and price targets for $KRNT, check out Quiver Quantitative's $KRNT forecast page.
$KRNT Price Targets
Multiple analysts have issued price targets for $KRNT recently. We have seen 2 analysts offer price targets for $KRNT in the last 6 months, with a median target of $21.0.
Here are some recent targets:
- Erik Woodring from Morgan Stanley set a target price of $19.0 on 08/13/2026
- James Ricchiuti from Needham set a target price of $23.0 on 08/12/2026
Full Release
Total Revenue of $58.3 Million; Up Approximately 10% Year Over Year; At High End of Guidance
Adjusted EBITDA of $2.7 Million; Above Guidance Range
ARR Increased to $39.4 Million; Up 83% Year Over Year
AIC Revenue Increased 70% Year Over Year
AIC TCV Increased 70% to $162.4 Million
Screen Customers Accounted for 60% of Systems Shipped Year-to-Date;
Long-Run Jobs Drove 84% of Year-to-Date Impression Growth
Positive Operating Cash Flow for the Twelfth Consecutive Quarter
ROSH-HA`AYIN, Israel, Nov. 18, 2026 (GLOBE NEWSWIRE) -- Kornit Digital Ltd. (“Kornit”, “Kornit Digital” or the “Company”) (Nasdaq: KRNT), a global leader in on-demand, digital fashion and textile production, today reported financial results for the third quarter ended September 30, 2026.
“We delivered a strong third quarter, with revenue of $58.3 million, up nearly 10% year over year and at the high end of our guidance range. Adjusted EBITDA exceeded the high end of our guidance, and we generated positive operating cash flow for the twelfth consecutive quarter,” said Ronen Samuel, Chief Executive Officer of Kornit Digital. “We are also strengthening the quality and visibility of our growth. ARR increased 83% year over year, AIC revenue increased 70%, while AIC TCV grew 70% to $162.4 million. These results reflect growing customer commitments and a business increasingly aligned with customer production and success.”
“We are seeing digital move into the core of apparel manufacturing, including higher-volume work traditionally handled by screen printers. This large, underpenetrated market is now becoming addressable with digital. Year-to- date, screen customers accounted for approximately 60% of systems shipped, AIC accounted for 52% of systems shipped, and long-run jobs drove 84% of impression growth. Our industrial systems, consumables, software and workflow automation help manufacturers improve productivity, reduce inventory exposure and respond faster to demand. We are focused on scaling this transition and turning customer momentum into durable, profitable growth.”
Third Quarter 2026 Results of Operations
-
Total revenues for the third quarter of 2026 increased to $58.3 million compared with $53.1 million in the prior year period.
-
AIC revenues for the third quarter of 2026 increased by 70% compared with the prior year period and 19% sequentially.
-
ARR at the end of the third quarter was approximately $39.4 million compared with $21.5 million at the end of the prior year period.
-
GAAP gross profit margin for the third quarter of 2026 was 43.5%, in line with the prior year period. On a non-GAAP basis, gross profit margin was 45.8%, compared with 45.8% in the prior year period.
-
GAAP operating expenses for the third quarter of 2026 were $32.2 million, compared with $31.1 million in the prior year period. On a non-GAAP basis, operating expenses were $27.3 million compared with $25.8 million in the prior year period.
-
GAAP net loss for the third quarter of 2026 was $0.4 million, or ($0.01) per diluted share, compared with net loss of $2.6 million, or ($0.06) per diluted share, in the prior year period.
-
Non-GAAP net income for the third quarter of 2026 was $5.3 million, or $0.11 per diluted share, compared with non-GAAP net income of $4.2 million, or $0.09 per diluted share, in the prior year period.
-
Adjusted EBITDA for the third quarter of 2026 improved to $2.7 million compared with $1.1 million in the prior year period. Adjusted EBITDA margin for the third quarter of 2026 was 4.6% compared with 2.0% in the prior year period.
Fourth Quarter 2026 Guidance
For the fourth quarter of 2026, the Company currently expects its revenues to be in the range of $60 million to $65 million and its adjusted EBITDA margin to be between 6.5% and 9.0%.
Earnings Conference Call Information
The Company will host a conference call today, November 18, 2026, at 8:30 a.m. ET, or 3:30 p.m. Israel time, to discuss the results, followed by a question-and-answer session with the investor community.
A live webcast of the call can be accessed at ir.kornit.com . To access the call, participants may dial toll-free at 1-877-407-0792 or 1-201-689-8263. The toll-free Israeli number is 1 809 406 247.
To listen to a replay of the conference call, dial toll-free 1-844-512-2921 or 1-412-317-6671 and enter confirmation code 13762759. The telephone replay will be available approximately three hours after the completion of the live call until 11:59 pm ET on December 02, 2026. The call will also be available for replay via the webcast link on Kornit’s Investor Relations website.
About Kornit Digital
Kornit Digital (NASDAQ: KRNT) is a worldwide market leader in on-demand, digital fashion and textile production technologies. The Company offers end-to-end solutions including digital printing systems, inks, consumables, software, and fulfillment services through its global fulfillment network. Headquartered in Israel with offices in the USA, Europe, and Asia Pacific, Kornit Digital serves customers in more than 100 countries. To learn more, visit www.kornit.com .
Forward-Looking Statements
Certain statements in this press release are “forward-looking statements” within the meaning of the Private Securities Litigation Reform Act of 1995 and other U.S. securities laws. Forward-looking statements are characterized by the use of forward-looking terminology such as “will,” “expects,” “anticipates,” “believes,” “intends,” “planned,” or other similar words. These forward-looking statements include, but are not limited to, statements relating to the Company’s objectives, plans and strategies, including with respect to the Company’s AIC program, the Company’s prospective results of operations and financial condition, including the Company’s guidance for the fourth quarter of 2026; and all developments that the Company expects or anticipates will or may occur in the future. Forward-looking statements are not guarantees of future performance and are subject to risks and uncertainties. The Company has based these forward-looking statements on assumptions and assessments made by its management in light of their experience and their perception of historical trends, current conditions, expected future developments and other factors they believe to be appropriate. Important factors that could cause actual results, developments and business decisions to differ materially from those anticipated in these forward-looking statements include, among other things: the Company’s degree of success in developing, introducing and selling new or improved products and product enhancements including, specifically, the Company’s Presto products, the Company’s Atlas family of products and the Apollo direct-to-garment platform; the extent of the Company’s ability to increase sales of its systems, ink and consumables; the extent of the Company’s ability to continue to grow customer adoption of the AIC model; the development of the market for digital textile printing generally; the Company’s securities class action litigation expenses; and those additional factors referred to under “Risk Factors” in Item 3.D of the Company’s Annual Report on Form 20-F for the year ended December 31, 2025, filed with the SEC on March 26, 2026. Any forward-looking statements in this press release are made as of the date hereof, and will not be updated by the Company, whether as a result of new information, future events or otherwise, except as required by law.
Non-GAAP Discussion Disclosure
The Company presents certain non-GAAP financial measures in this press release and in the accompanying conference call to discuss the Company’s quarterly results. These non-GAAP financial measures reflect adjustments to corresponding GAAP financial measures in order to exclude the impact of the following: share-based compensation expenses; amortization of intangible assets; restructuring expenses; foreign exchange differences associated with ASC 842; and M&A and class action-related legal fees.
The Company defines “Adjusted EBITDA” as non-GAAP operating income (loss), which reflects the adjustments described in the preceding paragraph to the Company’s GAAP net income (loss), as further adjusted to exclude depreciation expense.
The purpose of the foregoing non-GAAP financial measures is to convey the Company’s performance exclusive of non-cash charges and other items that are considered by management to be outside of the Company’s core operating results. These non-GAAP measures are among the primary metrics management uses in planning for and forecasting future periods. Furthermore, the non-GAAP measures are regularly used internally to understand, manage, and evaluate the Company’s business and make operating decisions, and the Company believes that they are useful to investors as a consistent and comparable measure of the ongoing performance of the Company’s business. The Company’s non-GAAP financial measures are not meant to be considered in isolation or as a substitute for comparable GAAP measures and should be read only in conjunction with the Company’s consolidated financial statements prepared in accordance with GAAP. Additionally, these non-GAAP financial measures may differ materially from the non-GAAP financial measures used by other companies.
The reconciliation tables included below present a reconciliation of our non-GAAP financial measures to the most directly comparable GAAP financial measures for our results for the third quarter of 2026. We have not provided, however, in this press release guidance for our expected GAAP net loss margin in the fourth quarter of 2026, or a reconciliation of our guidance for Adjusted EBITDA margin in the fourth quarter of 2026 to the most directly comparable GAAP financial measure for that quarter (i.e., GAAP net loss margin), as the information needed to provide that GAAP guidance and that reconciliation is not available to us without unreasonable effort or with reasonable certainty from a quantitative perspective. We expect that the foregoing missing information related to our outlook on a GAAP basis for the fourth quarter of 2026 is likely to yield significant changes relative to our non-GAAP outlook in respect of the subject financial measure.
Investor Contact
Andrew G. Backman
Chief Capital Markets Officer
[email protected]
| KORNIT DIGITAL LTD. | ||||||
| AND ITS SUBSIDIARIES | ||||||
| CONSOLIDATED BALANCE SHEETS | ||||||
| (U.S. dollars in thousands) | ||||||
| September 30, | December 31, | |||||
|
2026
|
2025
|
|||||
| (Unaudited) | (Audited) | |||||
| ASSETS | ||||||
| CURRENT ASSETS: | ||||||
| Cash and cash equivalents | $ | 29,006 | $ | 35,476 | ||
| Short-term bank deposit | 311,630 | 368,446 | ||||
| Marketable securities | 35,443 | 53,926 | ||||
| Trade receivables, net | 53,223 | 60,796 | ||||
| Inventory | 55,651 | 47,211 | ||||
| Other accounts receivable and prepaid expenses | 35,847 | 29,661 | ||||
| Total current assets | 520,800 | 595,516 | ||||
| LONG-TERM ASSETS: | ||||||
| Marketable securities | 51,941 | 33,332 | ||||
| Severance pay fund | 418 | 385 | ||||
| Property,plant and equipment, net | 77,806 | 69,492 | ||||
| Operating lease right-of-use assets | 15,870 | 17,174 | ||||
| Intangible assets, net | 18,831 | 9,429 | ||||
| Goodwill | 32,825 | 29,164 | ||||
| Other long-term assets | 17,933 | 16,018 | ||||
| Total long-term assets | 215,624 | 174,994 | ||||
| Total assets | 736,424 | 770,510 | ||||
| LIABILITIES AND SHAREHOLDERS' EQUITY | ||||||
| CURRENT LIABILITIES: | ||||||
| Trade payables | 19,593 | 6,059 | ||||
| Employees and payroll accruals | 16,030 | 13,214 | ||||
| Deferred revenues and advances from customers | 1,459 | 1,529 | ||||
| Operating lease liabilities | 3,811 | 3,886 | ||||
| Other payables and accrued expenses | 22,164 | 17,305 | ||||
| Total current liabilities | 63,057 | 41,993 | ||||
| LONG-TERM LIABILITIES: | ||||||
| Deferred tax liability | 1,668 | - | ||||
| Accrued severance pay | 1,094 | 1,155 | ||||
| Operating lease liabilities | 13,526 | 14,727 | ||||
| Other long-term liabilities | 3,567 | 62 | ||||
| Total long-term liabilities | 19,855 | 15,944 | ||||
| SHAREHOLDERS' EQUITY | 653,512 | 712,573 | ||||
| Total liabilities and shareholders' equity | $ | 736,424 | $ | 770,510 | ||
| KORNIT DIGITAL LTD. | ||||||||||||
| AND ITS SUBSIDIARIES | ||||||||||||
| CONSOLIDATED STATEMENTS OF OPERATIONS | ||||||||||||
| (U.S. dollars in thousands, except share and per share data) | ||||||||||||
| Three Months Ended | Nine Months Ended | |||||||||||
| September 30, | September 30, | |||||||||||
| 2026 | 2025 | 2026 | 2025 | |||||||||
| (Unaudited) | (Unaudited) | |||||||||||
| Revenues | ||||||||||||
| Products | $ | 40,028 | $ | 38,134 | $ | 115,155 | $ | 110,412 | ||||
| Services | 18,313 | 15,000 | 47,045 | 38,933 | ||||||||
| Total revenues | 58,341 | 53,134 | 162,200 | 149,345 | ||||||||
| Cost of revenues | ||||||||||||
| Products | 16,416 | 16,155 | 50,371 | 49,735 | ||||||||
| Services | 16,552 | 13,890 | 43,002 | 35,977 | ||||||||
| Total cost of revenues | 32,968 | 30,045 | 93,373 | 85,712 | ||||||||
| Gross profit | 25,373 | 23,089 | 68,827 | 63,633 | ||||||||
| Operating expenses: | ||||||||||||
| Research and development, net | 9,224 | 9,013 | 28,009 | 27,434 | ||||||||
| Sales and marketing | 14,826 | 14,221 | 45,952 | 44,163 | ||||||||
| General and administrative | 8,137 | 7,907 | 30,064 | 23,025 | ||||||||
| Total operating expenses | 32,187 | 31,141 | 104,025 | 94,622 | ||||||||
| Operating loss | (6,814) | (8,052) | (35,198) | (30,989) | ||||||||
| Financial income, net | 6,651 | 5,540 | 16,127 | 16,388 | ||||||||
| Income (loss) before taxes on income | (163) | (2,512) | (19,071) | (14,601) | ||||||||
| Taxes on income | 256 | 80 | 731 | 568 | ||||||||
| Net income (loss) | $ | (419) | $ | (2,592) | $ | (19,802) | $ | (15,169) | ||||
| Basic income (loss) per share | $ | (0.01) | $ | (0.06) | $ | (0.46) | $ | (0.33) | ||||
| Weighted average number of shares | ||||||||||||
| used in computing basic net income (loss) per share | 42,722,932 | 44,908,580 | 43,276,162 | 45,291,359 | ||||||||
| Diluted income (loss) per share | $ | (0.01) | $ | (0.06) | $ | (0.46) | $ | (0.33) | ||||
| Weighted average number of shares | ||||||||||||
| used in computing diluted net income (loss) per share | 42,722,932 | 44,908,580 | 43,276,162 | 45,291,359 | ||||||||
| KORNIT DIGITAL LTD. | |||||||||||||
| AND ITS SUBSIDIARIES | |||||||||||||
| RECONCILIATION OF GAAP TO NON-GAAP CONSOLIDATED STATEMENTS OF OPERATIONS | |||||||||||||
| (U.S. dollars in thousands, except share and per share data) | |||||||||||||
| Three Months Ended | Nine Months Ended | ||||||||||||
| September 30, | September 30, | ||||||||||||
| 2026 | 2025 | 2026 | 2025 | ||||||||||
| (Unaudited) | (Unaudited) | ||||||||||||
| Revenues | $ | 58,341 | $ | 53,134 | $ | 162,200 | $ | 149,345 | |||||
| GAAP cost of revenues | $ | 32,968 | $ | 30,045 | $ | 93,373 | $ | 85,712 | |||||
| Cost of product recorded for share-based compensation (1) | (447) | (526) | (1,329) | (1,587) | |||||||||
| Cost of service recorded for share-based compensation (1) | (397) | (394) | (1,159) | (1,193) | |||||||||
| Intangible assets amortization on cost of product (2) | (152) | (152) | (450) | (450) | |||||||||
| Intangible assets amortization on cost of service (2) | (362) | (159) | (682) | (479) | |||||||||
| Restructuring expenses (3) | - | (29) | (167) | (1,055) | |||||||||
|
Tariff (6)
|
- | - | (228 | - | |||||||||
| Non-GAAP cost of revenues | $ | 31,610 | $ | 28,785 | $ | 89,358 | $ | 80,948 | |||||
| GAAP gross profit | $ | 25,373 | $ | 23,089 | $ | 68,827 | $ | 63,633 | |||||
| Gross profit adjustments | 1,358 | 1,260 | 4,015 | 4,764 | |||||||||
| Non-GAAP gross profit | $ | 26,731 | $ | 24,349 | $ | 72,842 | $ | 68,397 | |||||
| GAAP operating expenses | $ | 32,187 | $ | 31,141 | $ | 104,025 | $ | 94,622 | |||||
| Share-based compensation (1) | (4,181) | (4,704) | (12,359) | (13,920) | |||||||||
| Intangible assets amortization (2) | (333) | (75) | (481) | (223) | |||||||||
| Restructuring expenses (3) | (197) | (547) | (1,902) | (547) | |||||||||
| M&A‑related costs (4) | 15 | - | (386) | - | |||||||||
| Class action - legal fees (5) | (164) | - | (7,252) | - | |||||||||
| Non-GAAP operating expenses | $ | 27,327 | $ | 25,815 | $ | 81,645 | $ | 79,932 | |||||
| GAAP Financial income, net | $ | 6,651 | $ | 5,540 | $ | 16,127 | $ | 16,388 | |||||
| Foreign exchange income (losses) associated with ASC 842 | 508 | 201 | 24 | 1,736 | |||||||||
| Non-GAAP Financial income , net | $ | 6,143 | $ | 5,741 | $ | 16,103 | $ | 18,124 | |||||
| GAAP Taxes on income | $ | 256 | $ | 80 | $ | 731 | $ | 568 | |||||
| Non-GAAP Taxes on income | $ | 256 | $ | 80 | $ | 731 | $ | 568 | |||||
| GAAP Net income (loss) | $ | (419) | $ | (2,592) | $ | (19,802) | $ | (15,169) | |||||
| Share-based compensation (1) | 5,025 | 5,624 | 14,847 | 16,700 | |||||||||
| Intangible assets amortization (2) | 847 | 386 | 1,613 | 1,152 | |||||||||
| Restructuring expenses (3) | 197 | 576 | 2,069 | 1,602 | |||||||||
| Foreign exchange losses associated with ASC 842 | (508) | 201 | (24) | 1,736 | |||||||||
| M&A‑related costs (4) | (15) | - | 386 | - | |||||||||
| Class action - legal fees (5) | 164 | - | 7,252 | - | |||||||||
|
Tariff (6)
|
- | - | 228 | - | |||||||||
| Non-GAAP net income | $ | 5,291 | $ | 4,195 | $ | 6,569 | $ | 6,021 | |||||
| GAAP diluted income (loss) per share | $ | (0.01) | $ | (0.06) | $ | (0.46) | $ | (0.33) | |||||
| Non-GAAP diluted income per share | $ | 0.11 | $ | 0.09 | $ | 0.14 | $ | 0.13 | |||||
| Weighted average number of shares | |||||||||||||
| Shares used in computing GAAP diluted net income (loss) per share | 42,722,932 | 44,908,580 | 43,276,162 | 45,291,359 | |||||||||
| Shares used in computing Non-GAAP diluted net income per share | 46,026,968 | 45,241,853 | 46,216,094 | 45,701,943 | |||||||||
| (1) Share-based compensation | |||||||||||||
| Cost of product revenues | $ | 447 | $ | 526 | $ | 1,329 | $ | 1,587 | |||||
| Cost of service revenues | 397 | 394 | 1,159 | 1,193 | |||||||||
| Research and development | 1,110 | 1,194 | 3,064 | 3,609 | |||||||||
| Sales and marketing | 1,486 | 1,730 | 4,681 | 5,098 | |||||||||
| General and administrative | 1,585 | 1,780 | 4,614 | 5,213 | |||||||||
| $ | 5,025 | $ | 5,624 | $ | 14,847 | $ | 16,700 | ||||||
| (2) Intangible assets amortization | |||||||||||||
| Cost of product revenues | $ | 152 | $ | 152 | $ | 450 | $ | 450 | |||||
| Cost of service revenues | 362 | 159 | 682 | 479 | |||||||||
| Sales and marketing | 333 | 75 | 481 | 223 | |||||||||
| $ | 847 | $ | 386 | $ | 1,613 | $ | 1,152 | ||||||
| (3) Restructuring expenses | |||||||||||||
| Cost of product revenues | $ | - | $ | 11 | $ | - | $ | 1,037 | |||||
| Cost of service revenues | - | 18 | 167 | 18 | |||||||||
| Research and development | - | 44 | 87 | 44 | |||||||||
| Sales and marketing | 1 | 374 | 1,582 | 374 | |||||||||
| General and administrative | 196 | 129 | 233 | 129 | |||||||||
| $ | 197 | $ | 576 | $ | 2,069 | $ | 1,602 | ||||||
| (4) M&A-related costs | |||||||||||||
| General and administrative | $ | (15) | $ | - | $ | 386 | $ | - | |||||
| (5) Class action - legal fees | |||||||||||||
| General and administrative | $ | 164 | $ | - | $ | 7,252 | $ | - | |||||
|
(6) Tariff
|
|||||||||||||
| Cost of product revenues | $ | - | $ | - | $ | 228 | $ | - | |||||
| KORNIT DIGITAL LTD. | ||||||||||||
| AND ITS SUBSIDIARIES | ||||||||||||
| CONSOLIDATED STATEMENTS OF CASH FLOWS | ||||||||||||
| (U.S. dollars in thousands) | ||||||||||||
| Three Months Ended | Nine Months Ended | |||||||||||
| September 30, | September 30, | |||||||||||
|
2026
|
2025
|
2026
|
2025
|
|||||||||
| (Unaudited) | (Unaudited) | |||||||||||
| Cash flows from operating activities: | ||||||||||||
| Net income (loss) | $ | (419) | $ | (2,592) | $ | (19,802) | $ | (15,169) | ||||
| Adjustments to reconcile net loss to net cash provided by operating activities: | ||||||||||||
| Depreciation and amortization | 4,107 | 2,931 | 10,597 | 8,707 | ||||||||
| Impairment of long-lived assets | 5 | - | 1,269 | - | ||||||||
| Share-based compensation | 5,026 | 5,624 | 14,848 | 16,700 | ||||||||
| Amortization of premium and accretion of discount on marketable securities, net | (45) | (224) | (263) | (774) | ||||||||
| Realized loss on sale and redemption of marketable securities | - | (36) | (63) | (58) | ||||||||
| Loss from disposal of property and Equipments | - | 22 | 156 | |||||||||
| Change in operating assets and liabilities: | ||||||||||||
| Trade receivables, net | (903) | (271) | 8,313 | 731 | ||||||||
| Other accounts receivables and prepaid expenses | (688) | (3,007) | (6,187) | (5,879) | ||||||||
| Inventory | (2,243) | 675 | (8,984) | 8,275 | ||||||||
| Operating leases right-of-use assets and liabilities, net | (491) | 231 | 28 | 1,661 | ||||||||
| Deposits and other long term assets | 397 | (185) | (1,919) | (3,732) | ||||||||
| Trade payables | (1,482) | (4,045) | 8,908 | (3,952) | ||||||||
| Employees and payroll accruals | 592 | (666) | 4,203 | 988 | ||||||||
| Deferred revenues and advances from customers | (177) | 166 | (1,379) | (607) | ||||||||
| Other payables and accrued expenses | (3,035) | 4,885 | 4,331 | 6,584 | ||||||||
| Accrued severance pay, net | (139) | 874 | (94) | 257 | ||||||||
| Other long - term liabilities | 41 | (34) | 70 | (46) | ||||||||
| Net cash provided by operating activities | 546 | 4,348 | 13,876 | 13,842 | ||||||||
| Cash flows from investing activities: | ||||||||||||
| Purchase of property, plant and equipment and capitalized software development costs | (6,623) | (3,557) | (17,404) | (13,136) | ||||||||
| Proceeds from (investment in) short-term bank deposits, net | 27,966 | (31,366) | 56,816 | (131,869) | ||||||||
| Proceeds from sales and redemption of marketable securities | 5,102 | 7,000 | 13,102 | 13,060 | ||||||||
| Proceeds from maturities of marketable securities | 24,300 | 64,278 | 48,620 | 207,400 | ||||||||
| Investment in marketable securities | (39,940) | (27,648) | (62,638) | (60,226) | ||||||||
| Cash paid in connection with acquisition, net of cash acquired | (117) | - | (5,937) | - | ||||||||
| Net cash provided by (used in) investing activities | 10,688 | 8,707 | 32,559 | 15,229 | ||||||||
| Cash flows from financing activities: | ||||||||||||
| Exercise of employee stock options | 55 | 40 | 245 | 808 | ||||||||
| Payments related to shares withheld for taxes | (373) | (258) | (1,428) | (1,627) | ||||||||
| Repurchase of ordinary shares | (15,016) | - | (52,502) | (25,000) | ||||||||
| Prepaid for financial services | (700) | - | (700) | |||||||||
| Increase in other financial liabilities | - | - | 1,480 | - | ||||||||
| Net cash used in financing activities | (16,034) | (218) | (52,905) | (25,819) | ||||||||
| Increase (decrease) in cash and cash equivalents | (4,800) | 12,837 | (6,470) | 3,252 | ||||||||
| Cash and cash equivalents at the beginning of the period | 33,806 | 25,418 | 35,476 | 35,003 | ||||||||
| Cash and cash equivalents at the end of the period | $ | 29,006 | $ | 38,255 | $ | 29,006 | $ | 38,255 | ||||
| Non-cash investing and financing activities: | ||||||||||||
| Purchase of property and equipment on credit | 2,981 | 1,139 | 3,834 | 1,139 | ||||||||
| Inventory transferred to be used as property and equipment | 821 | 346 | 1,665 | 3,299 | ||||||||
| Property, plant and equipment transferred to be used as inventory | 70 | - | 1,117 | 234 | ||||||||
| Lease liabilities arising from obtaining right-of-use assets | 513 | 175 | 1,542 | 1,258 | ||||||||
| Fair value of contingent obligations to selling shareholders provided as consideration for business combination | - | - | 2,443 | - | ||||||||
| KORNIT DIGITAL LTD. | ||||||||||||
| AND ITS SUBSIDIARIES | ||||||||||||
| RECONCILIATION OF GAAP NET INCOME TO ADJUSTED EBITDA | ||||||||||||
| (U.S. dollars in thousands, except share and per share data) | ||||||||||||
| Three Months Ended | Nine Months Ended | |||||||||||
| September 30, | September 30, | |||||||||||
|
2026
|
2025
|
2026
|
2025
|
|||||||||
| (Unaudited) | (Unaudited) | |||||||||||
| GAAP Revenues | $ | 58,341 | $ | 53,134 | $ | 162,200 | $ | 149,345 | ||||
| GAAP Net income (loss) | (419) | (2,592) | (19,802) | (15,169) | ||||||||
| Taxes on income | 256 | 80 | 731 | 568 | ||||||||
| Financial income | (6,651) | (5,540) | (16,127) | (16,388) | ||||||||
| Share-based compensation | 5,025 | 5,624 | 14,847 | 16,700 | ||||||||
| Intangible assets amortization | 847 | 386 | 1,613 | 1,152 | ||||||||
| Restructuring expenses | 197 | 576 | 2,069 | 1,602 | ||||||||
| M&A‑related costs | (15) | 386 | - | |||||||||
| Class action - legal fees | 164 | - | 7,252 | - | ||||||||
| Tariff | - | - | 228 | - | ||||||||
| Non-GAAP Operating income (loss) | (596) | (1,466) | (8,803) | (11,535) | ||||||||
| Depreciation | 3,260 | 2,545 | 8,984 | 7,555 | ||||||||
| Adjusted EBITDA | $ | 2,664 | $ | 1,079 | $ | 181 | $ | (3,980) | ||||