


GDEV Inc. reports Q2 2026 revenue of $94 million, a 22% decline; profit increases to $20 million.
Quiver AI Summary
GDEV Inc. reported its financial results for the second quarter and first half of 2026, revealing a 22% year-over-year decline in revenue to $94 million, mainly due to reduced bookings. Selling and marketing expenses decreased by 38% to $33 million as the company adopted a more efficient marketing strategy. Despite decreased revenue, the company's profit after tax rose to $20 million from $17 million in the prior year, aided by a shift from losses to profits from equity-accounted associates. Adjusted EBITDA for Q2 decreased to $20 million, down from $22 million a year earlier. For the first half of 2026, revenue dropped by 11% to $193 million, though profits increased to $37 million from $31 million in 2025. The company also announced the sale of the mobile game "Island Hoppers" for $5 million, which is expected to provide an uplift in reported revenue due to the recognition of deferred revenue upon closing the deal.
Potential Positives
- Despite a year-over-year decrease in revenue, GDEV reported a net profit of $20 million in Q2 2026, up from $17 million in Q2 2025, indicating improved profitability.
- Selling and marketing expenses decreased significantly by 38% year-over-year, reflecting the company's focus on efficiency in user acquisition and cost management.
- Cash flows generated from operating activities turned positive at $10 million in Q2 2026 compared to negative $10 million in Q2 2025, signaling improved cash management.
- GDEV recorded a total profit of $37 million for the first half of 2026, an increase of 21% compared to $31 million for the same period in 2025, showing strong overall financial performance despite revenue challenges.
Potential Negatives
- Revenue decreased by 22% year-over-year in Q2 2026, indicating a significant downturn in business performance.
- Bookings from in-app purchases and advertising experienced substantial declines, with a decrease of 20% and 33% respectively, suggesting challenges in user engagement and monetization.
- The decline in monthly paying users by 23% in Q2 2026 raises concerns about the company's ability to attract and retain its customer base.
FAQ
What are GDEV's Q2 2026 revenue results?
GDEV reported revenue of $94 million for Q2 2026, a decrease of 22% year-over-year.
How did GDEV's profit change in Q2 2026?
The company's profit for Q2 2026 increased to $20 million, compared to $17 million in Q2 2025.
What factors contributed to GDEV's decreased revenue?
Revenue decline was primarily driven by a decrease in bookings and a reduction in monthly paying users.
What is GDEV's adjusted EBITDA for Q2 2026?
Adjusted EBITDA for Q2 2026 was $20 million, a decrease from $22 million in Q2 2025.
How did selling and marketing expenses change for GDEV?
Selling and marketing expenses fell by 38%, totaling $33 million in Q2 2026 compared to Q2 2025.
Disclaimer: This is an AI-generated summary of a press release distributed by GlobeNewswire. The model used to summarize this release may make mistakes. See the full release here.
$GDEV Insider Trading Activity
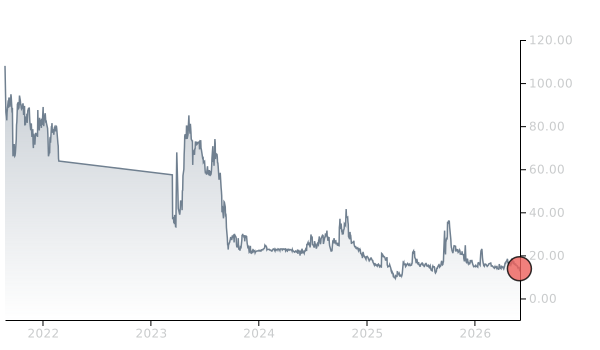
$GDEV insiders have traded $GDEV stock on the open market 1 times in the past 6 months. Of those trades, 0 have been purchases and 1 have been sales.
Here’s a breakdown of recent trading of $GDEV stock by insiders over the last 6 months:
- MARIE JULIETTE FRANCE HOLIVE sold 10,654 shares for an estimated $143,296
To track insider transactions, check out Quiver Quantitative's insider trading dashboard. You can access data on insider stock transactions through the Quiver Quantitative API insider transaction endpoint.
$GDEV Hedge Fund Activity
We have seen 2 institutional investors add shares of $GDEV stock to their portfolio, and 4 decrease their positions in their most recent quarter.
Here are some of the largest recent moves:
- FOCUS PARTNERS WEALTH removed 72,970 shares (-100.0%) from their portfolio in Q1 2026, for an estimated $1,021,580
- UBS GROUP AG removed 1,349 shares (-26.4%) from their portfolio in Q2 2026, for an estimated $16,970
- ADVISORSHARES INVESTMENTS LLC removed 1,000 shares (-7.6%) from their portfolio in Q2 2026, for an estimated $12,580
- TOWER RESEARCH CAPITAL LLC (TRC) added 256 shares (+inf%) to their portfolio in Q2 2026, for an estimated $3,220
- ACADIAN ASSET MANAGEMENT LLC removed 200 shares (-16.0%) from their portfolio in Q2 2026, for an estimated $2,516
- QUARRY LP added 18 shares (+inf%) to their portfolio in Q2 2026, for an estimated $226
- MORGAN STANLEY added 0 shares (+0.0%) to their portfolio in Q2 2026, for an estimated $0
To track hedge funds' stock portfolios, check out Quiver Quantitative's institutional holdings dashboard. You can access data on hedge funds moves and 13F filings through the Quiver Quantitative API 13F endpoint.
Full Release
LIMASSOL, Cyprus, Aug. 21, 2026 (GLOBE NEWSWIRE) -- GDEV Inc. (NASDAQ: GDEV), an international gaming and entertainment company (“GDEV” or the “Company”) released its unaudited financial and operational results for the second quarter and first half-year ended June 30, 2026.
Second quarter 2026 financial highlights:
- Revenue of $94 million decreased by 22% year-over-year.
- Selling and marketing expenses of $33 million decreased by 38% year-over-year.
- Profit for the period, net of tax, of $20 million in Q2 2026 increased vs. $17 million in Q2 2025.
-
Adjusted EBITDA amounted to $20 million in Q2 2026 decreased vs. $22 million in Q2 2025.
Second quarter and first half of 2026 financial performance in comparison
| US$ million | Q2 2026 | Q2 2025 | Change () | H1 2026 | H1 2025 | Change () | |||||||||||||
| Revenue | 94 | 120 | (22 | ) | % | 193 | 217 | (11 | ) | % | |||||||||
| Platform commissions | (18 | ) | (25 | ) | (29 | ) | % | (38 | ) | (46 | ) | (17 | ) | % | |||||
| Game operation cost | (15 | ) | (14 | ) | 2 | % | (28 | ) | (28 | ) | 2 | % | |||||||
| Selling and marketing expenses | (33 | ) | (53 | ) | (38 | ) | % | (69 | ) | (95 | ) | (27 | ) | % | |||||
| General and administrative expenses | (9 | ) | (9 | ) | (3 | ) | % | (18 | ) | (17 | ) | 9 | % | ||||||
| Profit for the period, net of tax | 20 | 17 | 20 | % | 37 | 31 | 21 | % | |||||||||||
| Adjusted EBITDA 1 | 20 | 22 | (7 | ) | % | 39 | 38 | 2 | % | ||||||||||
| Cash flows generated from operating activities | 10 | (10 | ) | N/M | 15 | (4 | ) | N/M | |||||||||||
Second quarter 2026 financial performance
In the second quarter of 2026, our revenue decreased by $26 million (or 22%) year-over-year and amounted to $94 million. The decrease was primarily driven by a decrease in bookings.
Platform commissions decreased by $7 million (or 29%) in the second quarter of 2026 compared to the same period in 2025 in line with the decrease in revenue.
Game operation costs remained relatively stable at the level of $15 million in the second quarter of 2026 vs. $14 million in the second quarter of 2025.
Selling and marketing expenses in the second quarter of 2026 decreased by $20 million vs. the same period in 2025, amounting to $33 million. This decrease is driven by our continued focus on improving the efficiency of user acquisition activities. The decrease reflects a more selective approach to performance marketing, prioritizing channels that attract players with higher long-term value over broad-scale campaigns aimed at short-term growth.
General and administrative expenses remained stable at $9 million in the second quarters of both 2026 and 2025.
As a result of the factors above, together with (i) the effect of a net foreign exchange loss in the second quarter of 2026 in the amount of $1 million vs. a net foreign exchange gain in the amount of $1 million in the same period of the prior year and (ii) share of profits of equity accounted associates in the second quarter of 2026 in the amount of $2 million vs. the share of losses of equity accounted associates in the amount of $2 million in the same period of the prior year, we recorded a profit for the period, net of tax, of $20 million in the second quarter of 2026 compared with $17 million in the same period of 2025. Adjusted EBITDA in the second quarter of 2026 amounted to $20 million, a decrease of $2 million compared with the same period in 2025 driven primarily by the same factors as those affecting the profit, except for the share of profits or losses of equity accounted associates, which do not impact the Adjusted EBITDA.
Cash flows generated from operating activities were positive $10 million in the second quarter of 2026 compared with negative $10 million in the same period in 2025.
________________________
1
For more information, see section titled “Presentation of Non-IFRS Financial Measures” on the last two pages of this report, including the reconciliation of the profit for the period, net of tax to the Adjusted EBITDA.
First half of 2026 financial performance
In the first half of 2026, our revenue decreased by $24 million (or 11%) year-over-year to $193 million. This decrease was primarily driven by a decrease in bookings.
Platform commissions decreased by $8 million (or 17%) in the first half of 2026 compared to the same period in 2025, driven by a decrease of revenues recognized from PC platforms.
Game operation cost remained stable at $28 million in the first halves of both 2026 and 2025.
Selling and marketing expenses in the first half of 2026 decreased by $25 million vs. the same period in 2025, amounting to $69 million. This decrease is driven by our continued focus on improving the efficiency of user acquisition activities. The decrease reflects a more selective approach to performance marketing, prioritizing channels that attract players with higher long-term value over broad-scale campaigns aimed at short-term growth.
General and administrative expenses remained relatively stable at $18 million in the first half of 2026 vs. $17 million in 2025.
As a result of the factors above, together with (i) the effect of a net foreign exchange loss in the first half of 2026 in the amount of $2 million vs. a net foreign exchange gain in the amount of $2 million in the same period of prior year and (ii) share of profits of equity accounted associates in the second quarter of 2026 in the amount of $2 million vs. the share of losses of equity accounted associates in the amount of $2 million in the same period of prior year, we recorded a profit for the period, net of tax, of $37 million compared with $31 million in the same period of 2025. Adjusted EBITDA in the first half of 2026 amounted to $39 million, an increase of $1 million compared with the same period in 2025 driven primarily by the same factors as those affecting the profit, except for the share of profits or losses of equity accounted associates, which do not impact the Adjusted EBITDA.
Cash flows generated from operating activities were positive $15 million in the first half of 2026 compared with negative $4 million in the same period in 2025.
Second quarter and first half 2026 operational performance comparison
| Q2 2026 | Q2 2025 | Change (%) | H1 2026 | H1 2025 | Change (%) | ||||||||||
| Bookings ($ million) | 73 | 92 | (21 | ) | % | 156 | 173 | (10 | ) | % | |||||
| Bookings from in-app purchases | 69 | 87 | (20 | ) | % | 148 | 163 | (9 | ) | % | |||||
| Bookings from advertising | 4 | 5 | (33 | ) | % | 8 | 10 | (17 | ) | % | |||||
| Share of advertising | 5.0 | % | 5.9 | % | (0.9 | ) | p.p. | 5.4 | % | 5.9 | % | (0.5 | ) | p.p. | |
| MPU (thousand) | 239 | 312 | (23 | ) | % | 254 | 298 | (15 | ) | % | |||||
| ABPPU ($) | 97 | 93 | 5 | % | 97 | 91 | 7 | % | |||||||
Bookings declined in the second quarter and first half of 2026 to reach $73 million and $156 million, respectively, compared with $92 million and $173 million in the same periods in 2025. The decline was primarily due to a decline in monthly paying users of 23% and 15% in the second quarter and first half of 2026, respectively, vs. the same periods in 2025.
The share of advertisement sales as a percentage of total bookings decreased in the second quarter and first half of 2026 by 0.9 p.p. and 0.5 p.p. vs. the same period in 2025.
| Split of bookings by platform | Q2 2026 | Q2 2025 | H1 2026 | H1 2025 | |||||
| Mobile | 65 | % | 63 | % | 64 | % | 61 | % | |
| PC | 35 | % | 37 | % | 36 | % | 39 | % |
In the second quarter of 2026, the share of mobile and PC versions of our games remained relatively stable while in the first half of 2026 we recorded an increase in share of mobile to reach 64% vs. 61% in the same period in 2025 and a decrease in share of PC to reach 36% vs. 39% in the same period in 2025.
| Split of bookings by geography | Q2 2026 | Q2 2025 | H1 2026 | H1 2025 | |||||
| US | 31 | % | 34 | % | 31 | % | 34 | % | |
| Asia | 17 | % | 19 | % | 18 | % | 20 | % | |
| Europe | 31 | % | 32 | % | 32 | % | 32 | % | |
| Other | 21 | % | 15 | % | 19 | % | 14 | % |
Our split of bookings by geography in the second quarter and first half of 2026 vs. the same periods in 2025 saw a decrease in the share of bookings derived from the US and Asia and an increase in bookings derived from other countries.
Note:
Due to rounding, the numbers presented throughout this release may not precisely add up to the totals. The period-over-period percentage changes are based on the actual numbers and may therefore differ from the percentage changes if those were to be calculated based on the rounded numbers.
Recent developments
On August 13, 2026, the Group entered into a game asset purchase agreement with an unrelated party for the sale of the mobile game "Island Hoppers", together with all related intellectual property and game assets, for a total consideration of $5.0 million, of which $4.5 million was received upon execution and $0.5 million represents a deferred payment contingent on the satisfaction of a gross revenue condition and completion of the agreed migration obligations.
Island Hoppers contributed approximately 1% to the Group’s bookings in the first half of 2026 and approximately 3% in the year ended December 31, 2025.
As a result of the transaction, deferred revenue related to Island Hoppers’ bookings, totaling $2.1 million as of June 30, 2026, will be recognized on an accelerated basis, providing a one-time uplift to reported revenue in the period of closing.
About GDEV
GDEV is a gaming and entertainment holding company, focused on development and growth of its franchise portfolio across various genres and platforms. With a diverse range of subsidiaries including Nexters and Cubic Games, among others, GDEV strives to create games that will inspire and engage millions of players for years to come. Its franchises, such as Hero Wars, Island Hoppers, Pixel Gun 3D and others have accumulated over 550 million installs and $2.5 billion of bookings worldwide. For more information, please visit www.gdev.inc
Contacts:
Investor Relations
Roman Safiyulin | Chief Corporate Development Officer
[email protected]
Cautionary statement regarding forward-looking statements
Certain statements in this press release may constitute “forward-looking statements” for purposes of the federal securities laws. Such statements are based on current expectations that are subject to risks and uncertainties. In addition, any statements that refer to projections, forecasts or other characterizations of future events or circumstances, including any underlying assumptions, are forward-looking statements.
The forward-looking statements contained in this press release are based on the Company’s current expectations and beliefs concerning future developments and their potential effects on the Company. There can be no assurance that future developments affecting the Company will be those that the Company has anticipated. Forward-looking statements involve a number of risks, uncertainties (some of which are beyond the Company’s control) or other assumptions. You should carefully consider the risks and uncertainties described in the “Risk Factors” section of the Company’s 2025 Annual Report on Form 20-F, filed by the Company on March 31, 2026, and other documents filed by the Company from time to time with the Securities and Exchange Commission. Should one or more of these risks or uncertainties materialize, or should any of the Company’s assumptions prove incorrect, actual results may vary in material respects from those projected in these forward-looking statements. Forward-looking statements speak only as of the date they are made. Readers are cautioned not to put undue reliance on forward-looking statements, and the Company undertakes no obligation to update or revise any forward-looking statements, whether as a result of new information, future events or otherwise, except as may be required under applicable securities laws.
Presentation of Non-IFRS Financial Measures
In addition to the results provided in accordance with IFRS throughout this press release, the Company has provided the non-IFRS financial measure “Adjusted EBITDA” (the “Non-IFRS Financial Measure”). The Company defines Adjusted EBITDA as the profit/loss for the period, net of tax as presented in the Company’s financial statements in accordance with IFRS, adjusted to exclude (i) goodwill and investments in equity-accounted associates’ impairment, (ii) loss on disposal of subsidiaries, (iii) income tax expense, (iv) other financial income, finance income and expenses other than foreign exchange gains and losses and bank charges, (v) change in fair value of share warrant obligations and other financial instruments, (vi) share of loss of equity-accounted associates, (vii) depreciation and amortization, (viii) share-based payments expense and (ix) certain non-cash or other special items that we do not consider indicative of our ongoing operating performance. The Company uses this Non-IFRS Financial Measure for business planning purposes and in measuring its performance relative to that of its competitors. The Company believes that this Non-IFRS Financial Measure is a useful financial metric to assess its operating performance from period-to-period by excluding certain items that the Company believes are not representative of its core business. This Non-IFRS Financial Measure is not intended to replace, and should not be considered superior to, the presentation of the Company’s financial results in accordance with IFRS. The use of the Non-IFRS Financial Measure terms may differ from similar measures reported by other companies and may not be comparable to other similarly titled measures.
Reconciliation of the profit for the period, net of tax to the Adjusted EBITDA
| US$ million | Q2 2026 | Q2 2025 | H1 2026 | H1 2025 | ||||||||
| Profit for the period, net of tax | 20 | 17 | 37 | 31 | ||||||||
| Adjust for: | ||||||||||||
| Income tax expense | 2 | 2 | 3 | 3 | ||||||||
| Adjusted finance income 2 | (0.6 | ) | (0.2 | ) | (1 | ) | (1 | ) | ||||
| Share of loss of equity-accounted associates | (2 | ) | 2 | (2 | ) | 2 | ||||||
| Change in fair value of share warrant obligations and other financial instruments | (0.1 | ) | (0.2 | ) | (0.2 | ) | (0.1 | ) | ||||
| Depreciation and amortization | 0.6 | 2 | 1 | 3 | ||||||||
| Share-based payments | 0.3 | 0.4 | 0.4 | 0.5 | ||||||||
| Adjusted EBITDA | 20 | 22 | 39 | 38 | ||||||||
________________________
2
Adjusted finance income/expenses consist of finance income and expenses other than foreign exchange gains and losses and bank charges, net.