



Equifax Canada's Q1 2026 report shows rising consumer debt and insolvencies, indicating economic challenges amid high interest rates.
Quiver AI Summary
Equifax Canada's Q1 2026 Market Pulse report highlights a complex state of consumer credit in Canada. Total consumer debt rose to $2.66 trillion, but non-mortgage debt decreased for the first time in several quarters as consumers adopted more cautious spending habits. Despite some financial discipline, insolvencies reached their highest level since 2009, with a significant increase in homeowners seeking financial relief through proposals rather than bankruptcy. A decline in new credit originations was noted, particularly among higher-risk consumers, amidst tighter lending conditions. While younger consumers showed improvement in repayment behaviors, a divide among seniors emerged, with those without mortgages experiencing financial growth, in contrast to mortgage-holding seniors facing increased financial pressures. Ongoing economic challenges, high interest rates, and inflation continue to affect consumer confidence and credit dynamics.
Potential Positives
- Equifax Canada's report highlights a significant shift in consumer behavior, with individuals demonstrating improved financial discipline by reducing holiday spending and paying down credit card balances in Q1 2026.
- The decline in non-mortgage debt for the first time in several quarters indicates that consumers may be actively managing their finances amidst high interest rates and inflation.
- Notably, there was a year-over-year improvement in repayment behavior among younger consumers aged 25 and under, suggesting a positive trend in financial management among this demographic.
- The increase in credit card payoff rates among seniors without mortgages points to a favorable financial situation for this group, contributing to overall stability in the consumer credit landscape.
Potential Negatives
- Insolvency volumes have reached the highest levels since 2009, indicating significant financial distress among consumers.
- New credit card originations have declined to a four-year low, suggesting decreased consumer access to credit and potential downturn in financial confidence.
- Average non-mortgage debt for insolvent consumers has increased, highlighting worsening financial conditions for borrowers.
FAQ
What does the latest Equifax report say about Canadian consumer debt?
The report reveals total consumer debt reached $2.66 trillion, rising 3.8% year-over-year, despite a decline in non-mortgage debt.
How have insolvency levels changed in Canada recently?
Insolvency volumes increased 18.8% year-over-year, hitting the highest levels since 2009, indicating widespread financial challenges among consumers.
What factors contributed to the decline in new credit card openings?
Declining population growth, consumer financial uncertainty, and tighter lending strategies have all contributed to a decrease in new credit card originations.
How does financial health vary across different age groups in Canada?
Younger consumers are showing improved repayment behavior, while seniors face contrasting financial situations based on their mortgage status.
What is the outlook for the Canadian housing market according to the report?
Despite lower vehicle prices easing some pressure, the housing market remains strained due to high mortgage delinquency rates in expensive regions.
Disclaimer: This is an AI-generated summary of a press release distributed by GlobeNewswire. The model used to summarize this release may make mistakes. See the full release here.
$EFX Insider Trading Activity
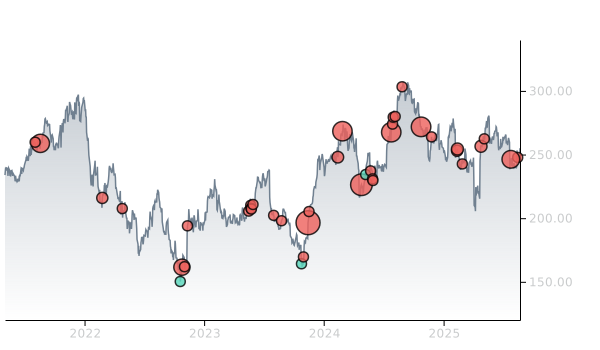
$EFX insiders have traded $EFX stock on the open market 21 times in the past 6 months. Of those trades, 1 have been purchases and 20 have been sales.
Here’s a breakdown of recent trading of $EFX stock by insiders over the last 6 months:
- MARK W BEGOR (CEO) has made 0 purchases and 15 sales selling 75,582 shares for an estimated $14,144,730.
- JOHN W JR GAMBLE (EVP, CFO & COO) has made 0 purchases and 2 sales selling 8,000 shares for an estimated $1,498,630.
- JAMIL FARSHCHI (EVP, Chief Technology Officer) has made 0 purchases and 2 sales selling 7,380 shares for an estimated $1,449,815.
- CHAD M BORTON (EVP, Pres Workforce Solutions) sold 2,535 shares for an estimated $485,452
- CECILIA MAO (EVP, Chief Product Officer) purchased 2,400 shares for an estimated $464,928
To track insider transactions, check out Quiver Quantitative's insider trading dashboard. You can access data on insider stock transactions through the Quiver Quantitative API insider transaction endpoint.
$EFX Revenue
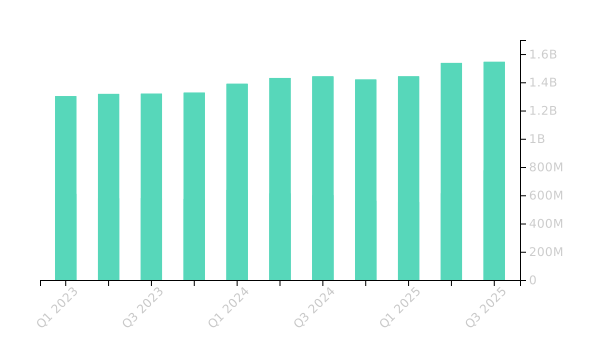
$EFX had revenues of $1.6B in Q1 2026. This is an increase of 198.71% from the same period in the prior year.
You can track EFX financials on Quiver Quantitative's EFX stock page.
You can access data on EFX stock through the Quiver Quantitative API.
$EFX Congressional Stock Trading
Members of Congress have traded $EFX stock 2 times in the past 6 months. Of those trades, 1 have been purchases and 1 have been sales.
Here’s a breakdown of recent trading of $EFX stock by members of Congress over the last 6 months:
- REPRESENTATIVE GILBERT RAY CISNEROS, JR. has traded it 2 times. They made 1 purchase worth up to $15,000 on 03/13 and 1 sale worth up to $15,000 on 04/14.
To track congressional stock trading, check out Quiver Quantitative's congressional trading dashboard. You can access data on congressional stock trades through the Quiver Quantitative API Congress trades endpoint.
$EFX Hedge Fund Activity
We have seen 452 institutional investors add shares of $EFX stock to their portfolio, and 490 decrease their positions in their most recent quarter.
Here are some of the largest recent moves:
- SOROBAN CAPITAL PARTNERS LP added 3,165,120 shares (+310.5%) to their portfolio in Q1 2026, for an estimated $560,827,612
- CAPITAL INTERNATIONAL INVESTORS removed 2,761,926 shares (-42.9%) from their portfolio in Q1 2026, for an estimated $489,385,667
- PARNASSUS INVESTMENTS, LLC removed 1,654,544 shares (-94.4%) from their portfolio in Q4 2025, for an estimated $359,002,957
- PRICE T ROWE ASSOCIATES INC /MD/ removed 1,599,598 shares (-38.0%) from their portfolio in Q1 2026, for an estimated $283,432,769
- AQR CAPITAL MANAGEMENT LLC added 1,427,871 shares (+424.9%) to their portfolio in Q1 2026, for an estimated $253,004,462
- FMR LLC added 1,258,790 shares (+533.4%) to their portfolio in Q1 2026, for an estimated $223,045,000
- T. ROWE PRICE INVESTMENT MANAGEMENT, INC. removed 1,006,593 shares (-57.3%) from their portfolio in Q4 2025, for an estimated $218,410,549
To track hedge funds' stock portfolios, check out Quiver Quantitative's institutional holdings dashboard. You can access data on hedge funds moves and 13F filings through the Quiver Quantitative API 13F endpoint.
$EFX Price Targets
Multiple analysts have issued price targets for $EFX recently. We have seen 15 analysts offer price targets for $EFX in the last 6 months, with a median target of $230.0.
Here are some recent targets:
- Curtis Nagle from B of A Securities set a target price of $225.0 on 05/19/2026
- Keith Mackey from RBC Capital set a target price of $31.0 on 05/08/2026
- Kyle Peterson from Needham set a target price of $265.0 on 04/27/2026
- Kevin Mcveigh from UBS set a target price of $220.0 on 04/23/2026
- Jeffrey Meuler from Baird set a target price of $245.0 on 04/22/2026
- Jason Haas from Wells Fargo set a target price of $230.0 on 04/22/2026
- Sean Kennedy from Mizuho set a target price of $222.0 on 04/16/2026
Full Release
– Latest report shows emerging credit stress slowed in Q1 but lingering effects of high interest rates and inflation led to highest insolvency levels since 2009 –
Equifax Canada ® Market Pulse Quarterly Consumer Credit Trends and Insights
TORONTO, May 26, 2026 (GLOBE NEWSWIRE) -- Equifax ® Canada’s Q1 2026 Market Pulse Quarterly Consumer Credit Trends and Insights reveals a complex start to the year for Canadian credit. While total consumer debt climbed to $2.66 trillion, up 3.8 per cent year-over-year, non-mortgage debt fell by more than $487 million in the first quarter. Notably, non-mortgage debt saw its first decline in several quarters, as consumers seemingly practiced post-holiday financial restraint.
Despite these signs of individual financial discipline, systemic risks seem to persist: insolvency volumes have increased to levels not seen since 2009, up 18.8 per cent year-over-year, indicating that many consumers may have reached a financial inflection point.
“The reduction in holiday spending at the close of 2025 translated into lower seasonal balance increases on credit cards,” said Rebecca Oakes, Vice President of Advanced Analytics at Equifax Canada. “This discipline enabled many Canadians to pay down balances during the first quarter, representing a critical shift in how consumers are navigating the current macroeconomic climate.”
Tightened lending and muted demand impact new credit openings
In the wake of reduced 2025 year-end spending, Q1 2026 saw a decline in demand across most credit categories. New credit card originations hit a four-year low, with growth limited exclusively to the super-prime and sub/near-prime segments. However, while higher-risk individuals sought more credit, lenders responded by reducing average credit limits for higher-risk consumers by 15 to 20 per cent. Conversely, consumers with high credit scores saw modest increases in their new card limits.
“Several factors could be driving a decline in new credit card openings in Canada,” Oakes explained. “First is the cooling of population growth as immigration programs have slowed. Second, and perhaps more telling, is the uncertainty in consumer financial confidence that triggers a shift toward spending less and saving more. Finally, lenders may be tightening their adjudication strategies to counter rising missed payments and economic uncertainty. All three of these factors are converging simultaneously, likely impacting new credit openings.”
Automotive sector slowdown despite lower prices
The slowdown extended to the automotive sector despite a softening in vehicle prices. New captive auto loans fell nearly 5 per cent year-over-year to a three-year low, while bank instalment loan volumes dropped by 9.5 per cent.
“While lower vehicle prices are certainly a positive for consumers, they are just one piece of the affordability puzzle,” Oakes noted. “When you consider the substantial increases in insurance premiums, along with rising maintenance and fuel costs, it seems clear why Canadians are being more cautious before committing to a new vehicle purchase.”
Mortgage stress remains concentrated in high-cost markets
The number of Canadians missing at least one credit payment in Q1 remained stable at 1.5 million (1 in 21 consumers), which indicated a sign of improvement for many groups of consumers. The percentage of active card users paying less than 25 per cent of their balance each month fell by more than 2 per cent, while the percentage paying their balances in full increased. Additionally, the percentage of minimum payers also saw a drop, with the biggest reduction seen with consumers aged 26-35 years old.
"Fluctuations in monthly credit card repayment amounts usually signal shifts in financial health," Oakes noted. "At this stage, it is uncertain if the observed gains reflect a genuine positive trend or merely a short-term correction following the spending pull-back seen at the end of 2025."
In Q1 2026, severe non-mortgage financial health indicators across Canada exhibited a regional divide. While the national 90+ day delinquency balance and volume rose by 4.18 per cent and 2.38 per cent respectively, certain provinces demonstrated resilience. Specifically, Quebec, Nova Scotia, Saskatchewan, and New Brunswick showed measurable improvements while the economic strain in Ontario, British Columbia, and Manitoba continued to rise.
Intensifying financial hardship for vulnerable borrowers
Q1 saw insolvency volume hit a 17-year high, partly due to escalating financial strain on mortgage holders. Homeowner insolvency volumes jumped by more than 11 per cent over Q4 2025, with over 90 per cent of these individuals choosing consumer proposals over bankruptcy. Total insolvency numbers remained higher among non-mortgage holders, but their quarterly growth was more modest, rising by 4.7 per cent compared to the final quarter of 2025.
While insolvency volumes reached their highest level since 2009, the overall insolvency rate rose to levels last seen in 2019 - the variance can likely be attributed to population growth. The severity of these insolvencies has worsened, however, with the average non-mortgage debt in these filings increasing to $43.3K in Q1 2026, up from $40.2K two years ago. This trend is even more pronounced for mortgage holders, whose average non-mortgage debt reached $82.4K, up by 19.0 per cent compared to two years ago.
This rising trend is also reflected in the average balances of delinquent accounts. For mortgage holders who have missed a payment, their average delinquent non-mortgage balances reached $54K in Q1, a 4.6 per cent increase compared to 12 months ago. The average balance of their delinquent mortgages also climbed by 13.2 per cent to $355.5K.
Younger consumers improve, seniors split by mortgage status
Q1 marked a pivotal shift for consumers aged 25 and under, who demonstrated a strengthening in repayment behaviour as both of their 90+ balance and volume delinquency rates recorded the first year-over-year improvement since mid-2022. Despite continued uncertainty in employment levels, the balance and volume of 90+ day missed payments declined by 2.2 per cent and 1.5 per cent respectively compared to 12 months ago.
Financial behaviour among seniors aged 55 and older revealed a stark divergence driven by mortgage status in retirement and beyond. Unburdened by housing payments, seniors without mortgages are experiencing strong financial momentum, effectively increasing their spending while simultaneously paying down credit card balances at accelerated rates. Notably, credit card payoff rates have jumped to 52.3 per cent for the 55 to 65 age bracket (up 1.0 per cent year-over-year), while consumers aged 65 and older reached a highly disciplined payoff rate of 62.6 per cent (a 1.5 per cent year-over-year increase). In contrast, seniors who carry a mortgage into their retirement years are seemingly facing heavily restricted cash flow, resulting in a financial squeeze that is likely forcing them to scale back on spending and forgo debt repayment efforts.
Housing market remains under pressure despite easing renewal wave
Although the 2025 mortgage renewal peak has passed, significant renewal volumes are expected during 2026. National arrears present a nuanced picture: the 90+ day volume delinquency rate sits at 0.22 per cent, remaining below pre-pandemic levels. However, the balance delinquency rate climbed 32 per cent year-over-year (and up 5 per cent quarterly) to 0.28 per cent. This missed payment level highlights severe financial strain in high-priced markets, with mortgage delinquencies jumping 52 per cent in Ontario and 36 per cent in British Columbia year-over-year.
“While the mortgage renewal wave is expected to slow towards the end of 2026, the transition to significantly higher interest rates continues to fuel financial impact and payment pressure. Consequently, ongoing monitoring of debts remains essential for Canadians,” concluded Oakes.
Age Group Analysis – Debt & Overall Balance Delinquency Rates (excluding mortgages)
|
Average
Debt (Q1 2026) |
Average Debt Change
Year-over-Year (Q1 2026 vs. Q1 2025) |
90+ Day
Delinquency Rate ($) (Q1 2026) |
Delinquency Rate($) Change
Year-over-Year (Q1 2026 vs. Q1 2025) |
90+ Day
Delinquency Rate (#) (Q1 2026) |
Delinquency Rate
(#) Change Year-over-Year (Q1 2026 vs. Q1 2025) |
||
| 18-25 | $8,781 | 3.53% | 2.18% |
-2.16%
|
2.52% |
-1.50%
|
|
| 26-35 | $17,441 | 0.07% | 2.64% | 6.75% | 2.56% | 3.73% | |
| 36-45 | $27,064 | 0.61% | 2.15% | 4.08% | 2.21% | 1.64% | |
| 46-55 | $34,775 | 1.11% | 1.62% | 6.79% | 1.79% | 2.95% | |
| 56-65 | $29,928 | 3.94% | 1.27% | 3.32% | 1.24% | 4.51% | |
| 65+ | $15,141 | 3.56% | 1.17% | 0.91% | 0.78% | 1.59% | |
| Canada | $22,278 | 1.91% | 1.77% | 4.18% | 1.77% | 2.38% | |
Major City Analysis
– Debt & Overall Balance Delinquency Rates (excluding mortgages)
| City |
Average
Debt (Q1 2026) |
Average Debt Change
Year-over-Year (Q1 2026 vs. Q1 2025) |
90+ Day
Delinquency Rate ($) (Q1 2026) |
Delinquency Rate Change
Year-over-Year (Q1 2026 vs. Q1 2025) |
90+ Day
Delinquency Rate (#) (Q1 2026) |
Delinquency Rate
(#) Change Year-over-Year (Q1 2026 vs. Q1 2025) |
|
| Calgary | $24,536 | 2.00% | 2.21% | 6.17% | 1.84% | 1.89% | |
| Edmonton | $23,855 | 0.79% | 2.72% |
-0.44%
|
2.26% |
-1.09%
|
|
| Halifax | $21,712 | 2.11% | 1.57% |
-0.82%
|
1.75% | 1.53% | |
| Montreal | $17,394 | 2.51% | 1.60% | 4.94% | 1.76% | 4.14% | |
| Ottawa | $19,628 | 0.68% | 1.64% | 6.27% | 1.50% | 5.13% | |
| Toronto | $21,465 | 1.97% | 2.35% | 6.88% | 2.23% | 4.08% | |
| Vancouver | $24,015 | 3.03% | 1.50% | 6.79% | 1.61% | 5.09% | |
| St. John's | $24,213 | 1.55% | 1.50% |
-0.44%
|
1.76% |
-2.31%
|
|
| Fort McMurray | $37,496 | 0.31% | 2.60% |
-10.54%
|
2.78% |
-5.85%
|
|
Province Analysis
- Debt & Overall Balance Delinquency Rates (excluding mortgages)
| Province |
Average
Debt (Q1 2026) |
Average Debt Change
Year-over-Year (Q1 2026 vs. Q1 2025) |
90+ Day
Delinquency Rate ($) (Q1 2026) |
Delinquency Rate Change
Year-over-Year (Q1 2026 vs. Q1 2025) |
90+ Day
Delinquency Rate (#) (Q1 2026) |
Delinquency Rate
(#) Change Year-over-Year (Q1 2026 vs. Q1 2025) |
|
| Ontario | $22,883 | 1.51% | 1.92% | 9.08% | 1.88% | 5.33% | |
| Quebec | $19,428 | 2.36% | 1.14% |
-1.10%
|
1.38% |
-0.23%
|
|
| Nova Scotia | $21,836 | 2.50% | 1.70% |
-1.14%
|
1.92% | 0.07% | |
| New Brunswick | $23,016 | 7.10% | 1.69% |
-6.70%
|
1.96% |
-4.75%
|
|
| PEI | $24,315 | 2.09% | 1.33% | 6.40% | 1.75% |
-0.96%
|
|
| Newfoundland | $25,062 | 1.37% | 1.62% | 1.24% | 1.89% |
-0.46%
|
|
| Eastern Region | $ 23,026 | 3.62 % | 1.65 % |
-2.02
%
|
1.92 % |
-1.68
%
|
|
| Alberta | $24,722 | 0.78% | 2.47% | 1.27% | 2.08% |
-0.78%
|
|
| Manitoba | $18,568 | 1.84% | 1.78% | 0.77% | 1.80% | 2.32% | |
| Saskatchewan | $23,464 | 1.01% | 1.75% |
-6.36%
|
1.82% |
-5.66%
|
|
| British Columbia | $23,121 | 2.14% | 1.61% | 3.88% | 1.68% | 2.97% | |
| Western Region | $ 23,285 | 1.51 % | 1.97 % | 1.50 % | 1.86 % | 0.58 % | |
| Canada | $22,278 | 1.91% | 1.77% | 4.18% | 1.77% | 2.38% | |
* Based on Equifax data for Q1 2026
About Equifax
At Equifax (NYSE: EFX), we believe knowledge drives progress. As a global data, analytics, and technology company, we play an essential role in the global economy by helping financial institutions, companies, employers, and government agencies make critical decisions with greater confidence. Our unique blend of differentiated data, analytics, and cloud technology drives insights to power decisions to move people forward. Headquartered in Atlanta and supported by nearly 15,000 employees worldwide, Equifax operates or has investments in 24 countries in North America, Central and South America, Europe, and the Asia Pacific region. For more information, visit
Equifax.ca
.
Contact:
Andrew Findlater
SELECT Public Relations
[email protected]
(647) 444-1197
Angie Andich
Equifax Canada Media Relations
[email protected]