


Bullish reported July 2026 trading metrics, including volumes and volatility for Bitcoin and Ethereum, on August 6.
Quiver AI Summary
Bullish, a global digital asset platform focused on institutional investors, announced its trading metrics for July 2026, detailing figures such as trading volume and volatility for Bitcoin and Ethereum. Key metrics highlighted include a total trading volume of around $52.2 billion, with spot trading comprising significant portions for BTC and ETH. The platform reported average trading spreads and volatility figures, emphasizing their calculated methodologies for assessing these metrics. Bullish also outlined its services, including the Bullish Exchange and CoinDesk, a media provider for digital assets. Investors are encouraged to check the company's website and social media for up-to-date information and disclosures.
Potential Positives
- Bullish recorded significant trading volume across various digital assets, indicating robust platform activity and user engagement.
- The company continues to deliver monthly performance metrics, enhancing transparency and investor access to relevant financial information.
- Bullish's compliance with regulatory standards, such as MiCAR for its European operations, underscores its commitment to operating within legal frameworks, increasing trust among investors.
Potential Negatives
- Monthly metrics showed a significant decline in trading volume for both Bitcoin and Ethereum compared to previous months, raising concerns about the platform's active user engagement and market presence.
- The press release indicated that the trading volume for Bitcoin and Ethereum was notably lower than the same month last year, suggesting potential challenges in attracting and retaining institutional clients.
- The trading spread for options and perpetuals showed fluctuations that could indicate instability or competitiveness issues in the platform's pricing strategy, which may deter potential traders.
FAQ
What are the key metrics released by Bullish for July 2026?
Bullish released metrics including trading volume, average trading spread, and volatility for Bitcoin and Ethereum.
Where can I find more information about Bullish's monthly metrics?
More information can be found in the monthly metrics packages available at investors.bullish.com.
What services does Bullish offer?
Bullish offers a regulated digital assets exchange, custody services, and market data analytics through CoinDesk.
How is trading volume calculated on Bullish?
Trading volume is the notional value of trades based on the quantity of assets and trade price exchanged.
What is the significance of average trading spread?
Average trading spread indicates the total commissions earned as a percentage of trading volume, reflecting trading costs.
Disclaimer: This is an AI-generated summary of a press release distributed by GlobeNewswire. The model used to summarize this release may make mistakes. See the full release here.
$BLSH Insider Trading Activity
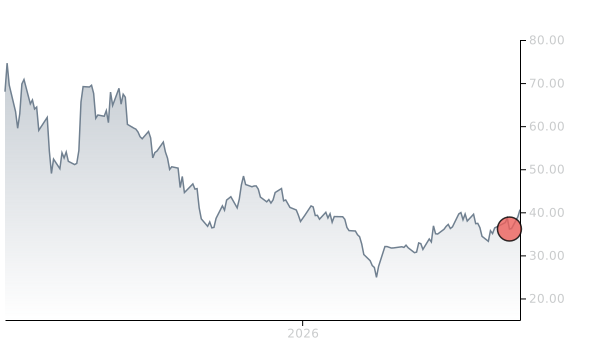
$BLSH insiders have traded $BLSH stock on the open market 9 times in the past 6 months. Of those trades, 0 have been purchases and 9 have been sales.
Here’s a breakdown of recent trading of $BLSH stock by insiders over the last 6 months:
- THOMAS W FARLEY (Chief Executive Officer) has made 0 purchases and 9 sales selling 160,494 shares for an estimated $6,428,715.
To track insider transactions, check out Quiver Quantitative's insider trading dashboard. You can access data on insider stock transactions through the Quiver Quantitative API insider transaction endpoint.
$BLSH Hedge Fund Activity
We have seen 110 institutional investors add shares of $BLSH stock to their portfolio, and 85 decrease their positions in their most recent quarter.
Here are some of the largest recent moves:
- FMR LLC added 1,829,687 shares (+36.8%) to their portfolio in Q1 2026, for an estimated $65,374,716
- AMOVA ASSET MANAGEMENT AMERICAS, INC. added 1,311,243 shares (+51.9%) to their portfolio in Q1 2026, for an estimated $46,850,712
- BLACKROCK, INC. removed 816,774 shares (-29.2%) from their portfolio in Q1 2026, for an estimated $29,183,335
- ALLIANCEBERNSTEIN L.P. removed 763,278 shares (-99.2%) from their portfolio in Q1 2026, for an estimated $27,271,922
- UBS GROUP AG removed 709,615 shares (-54.2%) from their portfolio in Q1 2026, for an estimated $25,354,543
- ARROWSTREET CAPITAL, LIMITED PARTNERSHIP removed 461,247 shares (-100.0%) from their portfolio in Q1 2026, for an estimated $16,480,355
- BALYASNY ASSET MANAGEMENT L.P. removed 333,372 shares (-100.0%) from their portfolio in Q1 2026, for an estimated $11,911,381
To track hedge funds' stock portfolios, check out Quiver Quantitative's institutional holdings dashboard. You can access data on hedge funds moves and 13F filings through the Quiver Quantitative API 13F endpoint.
$BLSH Price Targets
Multiple analysts have issued price targets for $BLSH recently. We have seen 4 analysts offer price targets for $BLSH in the last 6 months, with a median target of $42.75.
Here are some recent targets:
- Kenneth Worthington from JP Morgan set a target price of $26.0 on 06/16/2026
- Chris Brendler from Rosenblatt set a target price of $42.5 on 05/15/2026
- Brett Knoblauch from Cantor Fitzgerald set a target price of $43.0 on 05/15/2026
- Peter Christiansen from Citigroup set a target price of $65.0 on 03/18/2026
Full Release
GEORGE TOWN, Cayman Islands, Aug. 06, 2026 (GLOBE NEWSWIRE) -- Bullish (NYSE: BLSH) , an institutionally focused global digital asset platform that provides market infrastructure and information services, released its monthly metrics for July 2026 on Thursday, August 6, 2026 .
These metrics include trading volume, average trading spread, and measures of volatility for Bitcoin and Ethereum. For definitions and additional information regarding these metrics, please refer to the monthly metrics packages available on investors.bullish.com .
About Bullish
Bullish (NYSE: BLSH) is an institutionally focused global digital asset platform that provides regulated market infrastructure and information services. This includes Bullish Exchange – an institutionally focused digital assets spot and derivatives exchange, integrating a high-performance central limit order book matching engine with automated market making to provide deep and predictable liquidity. Bullish Europe is regulated under MiCAR as a crypto asset service provider offering spot trading and custody services for digital assets.
Bullish is the parent company of CoinDesk, a leading provider of digital asset media and information services. CoinDesk's offerings include: CoinDesk Indices – a collection of tradable proprietary and single-asset benchmarks and indices that track the performance of digital assets for global institutions in the digital assets and traditional finance industries; CoinDesk Data – a broad suite of digital asset market data and analytics, providing real-time insights into prices, trends and market dynamics; and CoinDesk Insights – a digital asset media and events provider and operator of coindesk.com , a digital media platform that covers news and insights about digital assets, the underlying markets, policy and blockchain technology.
For more information, please visit bullish.com and follow LinkedIn and X .
Use of Websites to Distribute Material Company Information
We use the Bullish Investor Relations website ( investors.bullish.com ) and our X account ( x.com/bullish ) to publicize information relevant to investors, including information that may be deemed material, in addition to filings we make with the U.S. Securities and Exchange Commission (SEC) and press releases. We encourage investors to regularly review the information posted on our website and X account in addition to our SEC filings and press releases to be informed of the latest developments.
Contacts
Media: [email protected]
Investor Relations: [email protected]
Source: Bullish
Additional Information & Disclosures
This monthly metrics package provides certain limited purpose monthly performance results of Bullish. This information is presented without commentary and should be read together with our most recent quarterly and annual results and our filings with the U.S. Securities and Exchange Commission (SEC), which are available on our Investor Relations website at investors.bullish.com .
The information provided is unaudited and the information for the months in the most recent fiscal quarter is preliminary, based on our estimates and subject to completion of our financial closing procedures. Final results for the quarter, as reported in our SEC filings, might vary from the information provided in this monthly metrics package.
Bullish expects to release monthly metrics packages for the prior month’s performance after the end of each month.
We use our Investor Relations website (investors.bullish.com) and our X account (x.com/bullish) to publicize information relevant to investors, including information that may be deemed material, in addition to filings we make with the SEC and press releases. We encourage investors to regularly review the information posted on our website and X account in addition to our SEC filings and press releases to be informed of the latest developments.
Definitions
Trading Volume represents the notional value of trades, i.e. the product of the quantity of assets transacted and the trade price at the time the transaction was executed. The quantity represents the total U.S. dollar equivalent value of matched trades transacted between a buyer and seller through our platform during the period of measurement.
Average Trading Spread represents total commissions earned from transactions on the Bullish Exchange for the period, expressed as a percentage of the trading volume for the period. Management reviews this metric, which reflects the cost of trading on the Bullish Exchange, changes in fair value of perpetual futures, and rebates, for insight into the average revenue generated per unit of trading volume on our platform.
Volatility is calculated using 1-minute price intervals from Coindesk Data's Adaptive Diversified Liquidity Index for BTC and ETH. We determine the daily volatility by measuring the standard deviation of these minute-by-minute price changes, which provides a more granular view of price fluctuations. This daily figure is then converted to an annualized volatility by multiplying it by the square root of 365, a standard practice for making risk metrics comparable over a one-year period.
|
Monthly Metrics Report for July 2026
|
||||||||||||||||||||
|
(Unaudited)
|
||||||||||||||||||||
|
2025
|
2026
|
|||||||||||||||||||
| Jan | Feb | Mar | Apr | May | Jun | Jul | Aug | Sep | Oct | Nov | Dec | Jan | Feb | Mar | Apr | May | Jun | Jul | ||
| (B - in billions) | ||||||||||||||||||||
| Trading Volume ($B) | ||||||||||||||||||||
| Spot - BTC | 34.6 | 30.9 | 43.2 | 39.2 | 32.8 | 19.9 | 20.8 | 18.2 | 16.4 | 38.2 | 38.4 | 25.9 | 22.5 | 41.8 | 29.1 | 20.9 | 16.8 | 26.9 | 16.7 | |
| Spot - ETH | 18.3 | 19.2 | 14.9 | 10.9 | 12.0 | 9.5 | 11.1 | 12.8 | 8.8 | 15.1 | 14.1 | 9.6 | 8.4 | 12.9 | 8.0 | 5.4 | 3.4 | 4.9 | 3.0 | |
| Spot - Stablecoin | 19.4 | 20.9 | 17.0 | 13.3 | 10.3 | 8.1 | 12.9 | 8.6 | 8.1 | 19.6 | 18.4 | 13.8 | 11.2 | 19.0 | 13.2 | 9.6 | 7.4 | 10.8 | 7.3 | |
| Spot - Other | 4.8 | 3.8 | 2.7 | 2.2 | 2.6 | 2.4 | 4.0 | 4.6 | 4.1 | 4.6 | 4.4 | 2.9 | 3.4 | 3.7 | 2.7 | 2.1 | 2.5 | 2.9 | 2.2 | |
| Total Spot | 77.1 | 74.8 | 77.7 | 65.5 | 57.6 | 39.9 | 48.8 | 44.3 | 37.3 | 77.5 | 75.3 | 52.2 | 45.4 | 77.4 | 52.9 | 38.0 | 30.0 | 45.5 | 29.1 | |
| Options | 0.0 | 0.0 | 0.0 | 2.8 | 6.2 | 4.8 | 3.6 | 3.2 | 5.6 | 0.9 | 2.3 | 0.2 | ||||||||
| Perpetual | 6.6 | 7.8 | 8.0 | 6.8 | 5.8 | 4.1 | 5.0 | 4.6 | 2.2 | 3.0 | 2.7 | 2.6 | 2.0 | 3.1 | 4.4 | 3.4 | 2.0 | 3.1 | 1.5 | |
| Total Trading Volume | 83.7 | 82.5 | 85.7 | 72.3 | 63.4 | 44.0 | 53.8 | 48.8 | 39.6 | 80.5 | 80.8 | 61.1 | 52.2 | 84.1 | 60.4 | 46.9 | 32.9 | 50.9 | 30.7 | |
| Average Trading Spread (bps) | ||||||||||||||||||||
| Spot | 2.14 | 1.97 | 1.87 | 1.65 | 1.55 | 1.58 | 1.76 | 2.55 | 1.96 | 1.75 | 1.94 | 1.82 | 1.74 | 2.22 | 2.01 | 2.05 | 2.40 | 2.84 | 2.71 | |
| Options | 1.00 | 0.93 | 1.29 | 1.34 | 1.66 | 1.95 | 2.42 | 1.86 | 2.50 | 1.65 | 0.59 | 1.09 | ||||||||
| Perpetual | (1.06) | (1.41) | (2.38) | (1.47) | (0.86) | (1.22) | (0.80) | (0.65) | 0.21 | (2.67) | (0.13) | (0.30) | (0.61) | 0.37 | 0.09 | (0.08) | (0.12) | (0.14) | 1.21 | |
| Average Trading Spread | 1.90 | 1.65 | 1.47 | 1.36 | 1.32 | 1.32 | 1.52 | 2.25 | 1.86 | 1.59 | 1.85 | 1.71 | 1.67 | 2.16 | 1.86 | 1.95 | 2.23 | 2.56 | 2.62 | |
| Monthly Average Volatility | ||||||||||||||||||||
| BTC | 48% | 44% | 50% | 44% | 33% | 28% | 27% | 28% | 23% | 38% | 45% | 39% | 33% | 61% | 48% | 35% | 28% | 47% | 32% | |
| ETH | 60% | 78% | 69% | 70% | 67% | 54% | 54% | 60% | 42% | 58% | 68% | 53% | 46% | 82% | 60% | 44% | 36% | 67% | 44% | |
| * Figures presented may not sum precisely due to rounding | ||||||||||||||||||||