



Ashland Inc. reports Q3 sales of $497 million, a 7% increase; net income rises to $16 million.
Quiver AI Summary
Ashland Inc. reported third-quarter fiscal 2026 sales of $497 million, a 7% increase from the previous year, with income from continuing operations at $41 million, or $0.89 per diluted share. Adjusted income, excluding intangibles amortization, was $47 million, while net income stood at $16 million. Sales volumes rose 6% across all business units, and adjusted EBITDA was $109 million, down 4% from last year, largely due to lower earnings in Specialty Additives and Intermediates. The company reaffirmed its fiscal 2026 sales guidance of $1.835 to $1.870 billion and adjusted EBITDA guidance of $385 to $400 million, highlighting ongoing positive momentum in core markets such as Life Sciences and Personal Care. Despite uncertain macroeconomic conditions, Ashland noted strong cash flow generation and a return to its long-term net leverage target, positioning itself for improved profitability moving forward.
Potential Positives
- Sales increased to $497 million, representing a seven percent growth from the prior year, indicating strong overall performance.
- Net income turned positive at $16 million compared to a significant loss of $742 million in the prior year, reflecting a substantial recovery in profitability.
- Ongoing Free Cash Flow reached $103 million, demonstrating strong cash generation capabilities.
- The company reaffirmed its full-year fiscal 2026 sales and Adjusted EBITDA guidance, showcasing confidence in sustained operational performance and financial stability moving forward.
Potential Negatives
- Adjusted EBITDA of $109 million is down four percent from the prior-year quarter, suggesting operational challenges despite overall sales growth.
- Adjusted Income from Continuing Operations Excluding Intangibles Amortization Expense decreased to $47 million, from $48 million a year ago, indicating a slight decline in underlying profitability.
- Revised adjusted EPS outlook to low-to-mid-single digit growth from mid-to-high-single digit growth due to a higher tax rate associated with unfavorable discrete items, potentially signaling concerns over future earnings performance.
FAQ
What were Ashland's sales figures for Q3 2026?
Sales for Ashland in Q3 2026 totaled $497 million, representing a seven percent increase from the prior-year quarter.
How much did Ashland's net income increase?
Net income for Ashland in Q3 2026 was $16 million, a significant increase from a loss of $742 million in the previous year.
What is Ashland's full-year sales guidance for fiscal 2026?
Ashland has reaffirmed its full-year sales guidance for fiscal 2026 to be between $1,835 million and $1,870 million.
What drove the growth in Ashland's Life Sciences segment?
The Life Sciences segment's growth was driven by high demand in pharmaceuticals and increased sales volumes across major regions.
How did Ashland manage raw material cost increases?
Ashland successfully recovered higher raw material costs through pricing actions, preserving margins while maintaining strong customer relationships.
Disclaimer: This is an AI-generated summary of a press release distributed by GlobeNewswire. The model used to summarize this release may make mistakes. See the full release here.
$ASH Revenue
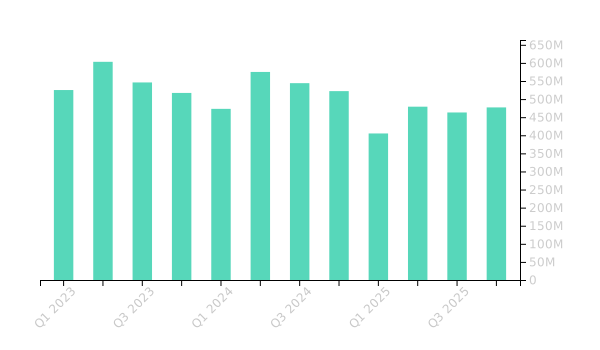
$ASH had revenues of $964M in Q2 2026. This is an increase of 101.25% from the same period in the prior year.
You can track ASH financials on Quiver Quantitative's ASH stock page.
You can access data on ASH stock through the Quiver Quantitative API.
$ASH Hedge Fund Activity
We have seen 149 institutional investors add shares of $ASH stock to their portfolio, and 140 decrease their positions in their most recent quarter.
Here are some of the largest recent moves:
- NORTHWESTERN MUTUAL WEALTH MANAGEMENT CO removed 1,437,157 shares (-100.0%) from their portfolio in Q1 2026, for an estimated $79,920,300
- FRONTIER CAPITAL MANAGEMENT CO LLC added 487,400 shares (+34.2%) to their portfolio in Q1 2026, for an estimated $27,104,314
- CITADEL ADVISORS LLC added 447,317 shares (+244.5%) to their portfolio in Q1 2026, for an estimated $24,875,298
- BOSTON PARTNERS added 349,457 shares (+621.4%) to their portfolio in Q1 2026, for an estimated $19,433,303
- TORONTO DOMINION BANK removed 268,775 shares (-100.0%) from their portfolio in Q1 2026, for an estimated $14,946,577
- DIMENSIONAL FUND ADVISORS LP added 267,741 shares (+12.0%) to their portfolio in Q1 2026, for an estimated $14,889,077
- MILLENNIUM MANAGEMENT LLC removed 257,004 shares (-55.4%) from their portfolio in Q1 2026, for an estimated $14,291,992
To track hedge funds' stock portfolios, check out Quiver Quantitative's institutional holdings dashboard. You can access data on hedge funds moves and 13F filings through the Quiver Quantitative API 13F endpoint.
$ASH Analyst Ratings
Wall Street analysts have issued reports on $ASH in the last several months. We have seen 1 firms issue buy ratings on the stock, and 0 firms issue sell ratings.
Here are some recent analyst ratings:
- Seaport Global issued a "Buy" rating on 05/06/2026
To track analyst ratings and price targets for $ASH, check out Quiver Quantitative's $ASH forecast page.
$ASH Price Targets
Multiple analysts have issued price targets for $ASH recently. We have seen 6 analysts offer price targets for $ASH in the last 6 months, with a median target of $63.5.
Here are some recent targets:
- Joshua Spector from UBS set a target price of $72.0 on 06/10/2026
- Michael J. Harrison from Seaport Global set a target price of $75.0 on 05/06/2026
- Michael Sison from Wells Fargo set a target price of $50.0 on 04/30/2026
- Jeffrey Zekauskas from JP Morgan set a target price of $65.0 on 04/30/2026
- Alexandra Yates from Argus Research set a target price of $56.0 on 03/23/2026
- Stephen Richardson from Evercore ISI Group set a target price of $62.0 on 02/18/2026
Full Release
- Sales of $497 million, up seven percent from the prior-year quarter
- Income from continuing operations of $41 million, or $0.89 per diluted share
- Adjusted Income from Continuing Operations Excluding Intangibles Amortization Expense of $47 million, or $1.02 per diluted share
- Net income of $16 million, or $0.35 per diluted share
- Sales volumes rose six percent from the prior-year quarter, with gains achieved across all business units
- Adjusted EBITDA of $109 million, down four percent from the prior-year quarter, primarily reflecting growth in Life Sciences and Personal Care, more than offset by lower Specialty Additives and Intermediates earnings
- Cash flows provided by operating activities of $121 million; Ongoing Free Cash Flow 2 of $103 million
- Reaffirming full‑year fiscal 2026 sales guidance of $1,835-$1,870 million and Adjusted EBITDA guidance of $385-$400 million
WILMINGTON, Del., July 28, 2026 (GLOBE NEWSWIRE) -- Ashland Inc. (NYSE: ASH) today announced financial results 1 for the third quarter of fiscal year 2026, which ended June 30, 2026, and reaffirmed its full-year fiscal 2026 sales and Adjusted EBITDA outlook. Ashland, a global additives and specialty ingredients company, holds leadership positions in high-quality, consumer-focused markets including pharmaceuticals, personal care and architectural coatings.
“Ashland’s third-quarter results reflected broad-based demand and strong commercial execution across the portfolio,” said Guillermo Novo, chair and chief executive officer, Ashland. “Sales increased seven percent year-over-year, with growth achieved across all business units and regions. Our teams continued to successfully recover higher raw material costs through pricing actions, preserving margins while maintaining strong customer relationships. Life Sciences delivered double-digit sales gains, benefiting from broad demand across pharma and continued progress from our globalize and innovate strategies. Personal Care generated another quarter of strong performance, led by momentum in biofunctional actives, high-single-digit growth in skin care, and favorable contributions from hair care and microbial protection. Specialty Additives benefited from continued growth in coatings and performance specialties driven by share gains and strong commercial momentum. In Intermediates, merchant sales increased, reflecting improving NMP demand for battery-related applications.”
Novo continued, “Our third quarter results reflected continued progress on the initiatives that are strengthening our operations and positioning the company for improved profitability over time. Plant operations improved during the quarter and profitability increased sequentially, and we recognize there is still work to do and expect continued progress as we advance our operational priorities and investments to improve reliability and throughput across the network.”
“Our globalize and innovate strategies continued to exceed our targets, driven by strong customer engagement, innovation execution and momentum across our differentiated portfolio,” Novo said. “We also generated healthy cash flow in the quarter, supported by disciplined inventory management. Importantly, we ended the quarter with net leverage of 2.4x, returning to our long-term target range and further strengthening our financial flexibility. As operational performance continues to improve and production increasingly aligns with demand, we expect greater flexibility across the network and an improving profitability profile. We are also expanding the reach of our technology platforms, creating new opportunities to deliver differentiated solutions, deepen customer engagement and support long-term value creation. While the macroeconomic environment remains uncertain, we remain focused on the factors within our control, including commercial execution, operating performance, cash generation and productivity.”
Third-quarter sales were $497 million, up seven percent from $463 million in the prior-year quarter. Sales volumes increased across all business units. Pricing increased by approximately one percent led by strength in Specialty Additives and Life Sciences. Foreign currency movements contributed a favorable $3 million, or one percent, to sales.
Net income was $16 million, up from a loss of $742 million in the prior year. Income from continuing operations was $41 million, or $0.89 per diluted share, compared to a loss of ($15.70) last year. Adjusted Income from Continuing Operations Excluding Intangibles Amortization Expense was $47 million, down from $48 million, or $1.02 per diluted share versus $1.04 in the prior year. Adjusted Operating Income was $63 million, down from $65 million last year. Adjusted EBITDA was $109 million, representing a 21.9 percent margin, down four percent from $113 million in the prior-year quarter, as favorable volumes and pricing actions were more than offset by the lingering impact of lower production rates experienced earlier in the fiscal year, inflationary cost pressures, and the normalization of incentive compensation from a low prior-year base. Foreign currency movements contributed a favorable $1 million to Adjusted EBITDA.
Average diluted shares outstanding were 46 million in the third quarter, flat versus 46 million in the prior-year quarter.
Cash flows provided by operating activities were $121 million, up from $114 million in the prior-year quarter, driven primarily by working capital improvements. Ongoing Free Cash Flow totaled $103 million versus $108 million in the prior‑year quarter as ongoing free cash flow conversion rates remained above 90% in both periods.
Reportable Segment Performance
To aid in the understanding of Ashland’s ongoing business performance, the results of Ashland reportable segments are described below on an adjusted basis. In addition, EBITDA and Adjusted EBITDA are reconciled to operating income in Table 4. Free Cash Flow, Ongoing Free Cash Flow and Adjusted Operating Income are reconciled in Table 6 and Adjusted Income from Continuing Operations, Adjusted Diluted Earnings Per Share and Adjusted Diluted Earnings Per Share Excluding Intangible Amortization Expense are reconciled in Table 7 of this news release. These adjusted results are considered non-GAAP financial measures. For a full description of the non-GAAP financial measures used, see the “Use of Non-GAAP Measures” section that further describes these adjustments below.
Life Sciences
Sales for the Life Sciences segment totaled $180 million in the third quarter, an increase of 11 percent compared to the prior-year quarter. Performance was driven by higher sales volumes, led by broad-based pharma demand across all major regions and product categories, continued strength in high-purity excipients and injectables, and customer order timing during the quarter. Pharma achieved double-digit sales growth, representing its fifth consecutive quarter of year-over-year volume gains, while Ashland's innovate strategy continued to support momentum in differentiated cellulose grades, injectables and low-nitrite products. Prices increased year-over-year following previously announced pricing actions, and foreign currency movements contributed a favorable impact of approximately $1 million to segment sales.
Adjusted Operating Income for the quarter was $45 million, up from $40 million in the prior‑year quarter. Adjusted EBITDA totaled $60 million, representing a 33 percent margin and an 11 percent increase versus $54 million last year. The year‑over‑year increase was driven primarily by higher volumes and favorable pricing and product mix, partially offset by higher SARD. Foreign currency movements had a negligible impact on Adjusted EBITDA in the quarter. Life Sciences continues to benefit from resilient pharma demand, broad-based volume growth, and strong commercial execution, supported by ongoing momentum across its globalize and innovate strategies.
Personal Care
Personal Care sales in the third quarter were $155 million, an increase of five percent compared to $147 million in the prior-year quarter. Performance was driven by strong volume growth across end markets and regions, including high-single-digit growth in skin care, mid-single-digit growth in hair care and low-single-digit growth in oral and home care. Care Ingredients delivered solid gains, biofunctional actives delivered strong double-digit growth and microbial protection delivered favorable growth supported by double-digit volume gains. Performance was led by the Americas and China and supported by continued progress across Ashland's globalize and innovate strategies. Pricing improved sequentially during the quarter, while foreign currency movements contributed approximately $1 million to segment sales.
Adjusted Operating Income was $30 million, up from $26 million in the prior‑year period. Adjusted EBITDA was $45 million, compared to $41 million in the prior-year quarter, representing a margin of 29 percent. Improved profitability was driven primarily by higher sales volumes and favorable product mix, partially offset by lower pricing. Personal Care delivered strong margins while continuing to advance targeted commercial and innovation initiatives across the portfolio.
Specialty Additives
Specialty Additives sales were $136 million in the third quarter; an increase of four percent compared to the prior-year quarter. Performance was driven by favorable pricing and mix, as continued growth in Coatings and Performance Specialties reflected strong commercial execution and share gains. These strengths more than offset the expected weakness in Construction and Energy and Resources, where market conditions remained challenged reflecting continuous softness in demand and deliberate portfolio management actions. Regionally, most markets improved compared with the prior year driven by strong execution from the commercial team. Foreign currency movements provided a favorable impact of approximately $1 million to segment sales.
Adjusted Operating Income was $5 million, compared to income of $9 million in the prior-year quarter, and Adjusted EBITDA was $20 million, down from $26 million in the prior-year quarter. Results were generally in line with expectations and continued to reflect the carryover effects of the operational challenges and lower production rates discussed earlier in the fiscal year, which contributed to higher operating costs during the quarter. These impacts were partially offset by favorable pricing and product mix. Foreign currency had a negligible impact on Adjusted EBITDA during the quarter.
Intermediates
Intermediates sales totaled $37 million in the third quarter; an increase of twelve percent compared to $33 million in the prior-year quarter. This included $26 million in merchant sales, compared to $23 million in the prior year, and $11 million in captive butanediol (BDO) sales, up $1 million year-over-year. Captive BDO sales are recognized at market‑based pricing. Merchant sales improved, driven by higher N‑Methyl‑2‑pyrrolidone (NMP) demand from North American EV battery and energy-storage customers. Foreign currency movements had a negligible impact on sales in the quarter.
Adjusted Operating Income was $3 million, compared to income of $4 million in the prior-year quarter. Adjusted EBITDA was $4 million, down from $7 million in the prior-year quarter. The year-over-year decline primarily reflected lower advanced manufacturing tax credit benefits compared to the prior-year quarter, while underlying operating performance remained broadly stable. Foreign currency had a negligible impact on Adjusted EBITDA during the quarter.
Unallocated & Other
Unallocated and other expense was $37 million compared to $49 million in the prior-year quarter. The year-over-year improvement primarily reflected favorable corporate items including lower environmental expenses and the benefit of tax credits, partially offset by higher compensation-related expenses. Adjusted unallocated and other expense EBITDA was $20 million compared to $15 million in the prior-year quarter.
Financial Outlook
Ashland is reaffirming its full year fiscal 2026 sales guidance of $1,835 to $1,870 million and its Adjusted EBITDA guidance of $385 to $400 million. Ashland is also revising its adjusted EPS outlook to low-to-mid-single digit growth from mid-to-high-single digit growth, reflecting a higher tax rate associated with unfavorable discrete items. The outlook reflects continued growth across the portfolio, ongoing momentum in higher value applications, increasing realization of recent pricing actions and strong cash generation.
Despite a mixed macroeconomic backdrop, Ashland’s core Life Sciences and Personal Care end markets continue to demonstrate resilient demand, supported by stable fundamentals, continued innovation adoption from customers and strong commercial execution. Specialty Additives trends continue to improve, driven by share gains in coatings and performance specialties.
Ashland continues to benefit from growth in differentiated, higher value applications, including biofunctional actives, microbial protection, injectables and tablet coatings. Recent pricing actions are contributing to results and are expected to provide greater benefit in the fourth quarter as realization increases. Raw material and freight costs are expected to remain elevated amid geopolitical supply pressures, although Ashland expects pricing actions to offset these impacts over time.
Updated guidance
- Sales: $1,835 to $1,870 million (no change)
- Adjusted EBITDA: $385 million to $400 million (no change)
- Adjusted Diluted Earnings Per Share Excluding Intangibles Amortization: low-to-mid single-digit growth
- Ongoing Free Cash Flow Conversion: greater than 50 percent of Adjusted EBITDA with capital expenditures of approximately $~90 million
“As we look ahead, our full year expectations reflect the underlying strength of our portfolio and the momentum we are seeing across the business,” concluded Guillermo Novo, chair and chief executive officer, Ashland. “Our globalize and innovate strategies continue to exceed expectations, demand remains resilient in our core franchise, and our teams are executing well against our innovative Technology Platforms and other priorities that support long term value creation. We expect continued sequential improvement in the fourth quarter as operational performance steadily improves. Combined with strong cash generation and disciplined execution, these actions position Ashland to carry improving earnings momentum into fiscal 2027.“
Conference Call Webcast
The company’s live webcast with securities analysts will include an executive summary and detailed remarks. The live webcast will take place at 9 a.m. ET on Wednesday, July 29, 2026. Simultaneously, the company will post a slide presentation in the Investor Relations section of its website at
http://investor.ashland.com
.
To access the call by phone, please go to this registration link and you will be provided with dial in details. To avoid delays, we encourage participants to dial into the conference call fifteen minutes ahead of the scheduled start time.
Following the live event, an archived version of the webcast and supporting materials will be available for 12 months at http://investor.ashland.com .
Use of Non-GAAP Measures
Ashland believes that by removing the impact of depreciation and amortization and excluding certain non-cash charges, amounts spent on interest and taxes, and certain other charges that are highly variable from year to year, EBITDA, Adjusted EBITDA, EBITDA Margin and Adjusted EBITDA Margin provide Ashland’s investors with performance measures that reflect the impact to operations from trends in changes in sales, margin and operating expenses, providing a perspective not immediately apparent from net income, operating income, net income margin, and operating income margin. The adjustments Ashland makes to derive the non-GAAP measures of EBITDA, Adjusted EBITDA, EBITDA Margin and Adjusted EBITDA Margin exclude items which may cause short-term fluctuations in net income and operating income and which Ashland does not consider to be the fundamental attributes or primary drivers of its business. EBITDA, Adjusted EBITDA, EBITDA Margin, and Adjusted EBITDA Margin provide disclosure on the same basis as that used by Ashland’s management to evaluate financial performance on a consolidated and reportable segment basis and provide consistency in our financial reporting, facilitate internal and external comparisons of Ashland’s historical operating performance and its business units, and provide continuity to investors for comparability purposes. EBITDA Margin and Adjusted EBITDA Margin are defined as EBITDA and Adjusted EBITDA divided by sales for the corresponding period.
Key items, which are set forth on Table 7 of this release, are defined as financial effects from significant transactions that, either by their nature or amount, have caused short-term fluctuations in net income and/or operating income which Ashland does not consider to reflect Ashland’s underlying business performance and trends most accurately. Further, Ashland believes that providing supplemental information that excludes the financial effects of these items in the financial results will enhance the investor’s ability to compare financial performance between reporting periods.
Tax-specific key items, which are set forth on Table 7 of this release, are defined as financial transactions, tax law changes or other matters that fall within the definition of key items as described above. These items relate solely to tax matters and would only be recorded within the income tax caption of the Statement of Consolidated Income. As with all key items, due to their nature, Ashland does not consider the financial effects of these tax-specific key items on net income to be the most accurate reflection of Ashland’s underlying business performance and trends.
The Free Cash Flow metrics enable Ashland to provide a better indication of the ongoing cash being generated that is ultimately available for both debt and equity holders as well as other investment opportunities. Unlike cash flow provided by operating activities, Free Cash Flow and Ongoing Free Cash Flow include the impact of capital expenditures from continuing operations and other significant items impacting Free Cash Flow, providing a more complete picture of current and future cash generation. Free Cash Flow, Ongoing Free Cash Flow, and Ongoing Free Cash Flow Conversion are non-GAAP liquidity measures that Ashland believes provide useful information to management and investors about Ashland’s ability to convert Adjusted EBITDA to ongoing Free Cash Flow. These liquidity measures are used regularly by Ashland’s stakeholders and industry peers to measure the efficiency at providing cash from regular business activity. Free Cash Flow, Ongoing Free Cash Flow, and Free Cash Flow Conversion have certain limitations, including that they do not reflect adjustments for certain non-discretionary cash flows such as mandatory debt repayments. The amount of mandatory versus discretionary expenditures can vary significantly between periods.
Adjusted Diluted Earnings Per Share is a performance measure used by Ashland and is defined by Ashland as earnings (loss) from continuing operations, adjusted for identified key items and divided by the number of outstanding diluted shares of common stock. Ashland believes this measure provides investors additional insights into operational performance by providing earnings and diluted earnings per share metrics that exclude the effect of the identified key items and tax specific key items.
The Adjusted Diluted Earnings Per Share Excluding Intangibles Amortization Expense metric enables Ashland to demonstrate the impact of non-cash intangibles amortization expense on earnings per share, in addition to key items previously mentioned. Ashland’s management believes this presentation is helpful to illustrate how previous acquisitions impact applicable period results.
Ashland does not quantitatively reconcile our guidance ranges for our non-GAAP measures to their most comparable GAAP measures in the Financial Outlook section of this news release. The guidance ranges for GAAP and non-GAAP financial measures reflect Ashland’s assessment of potential sources of variability in financial results and are informed by evaluation of multiple scenarios, many of which have interactive effects across several financial statement line items. Providing guidance for individual reconciling items between our non-GAAP financial measures and the comparable GAAP measures would imply a degree of precision and certainty in those reconciling items that is not a consistent reflection of our scenario-based process to prepare our guidance ranges. To the extent that a material change affecting the individual reconciling items between the company’s forward-looking non-GAAP and comparable GAAP financial measures is anticipated, the company has provided qualitative commentary in the Financial Outlook section of this news release for your consideration. However, as the impact of such factors cannot be predicted with a reasonable degree of certainty or precision, a quantitative reconciliation is not available without unreasonable effort.
About Ashland
Ashland Inc. (NYSE: ASH) is a global additives and specialty ingredients company with a conscious and proactive mindset for environmental, social and governance (ESG). The company serves customers in a wide range of consumer and industrial markets, including architectural coatings, construction, energy, food and beverage, personal care and pharmaceutical. Approximately 2,900 passionate, tenacious solvers – from renowned scientists and research chemists to talented engineers and plant operators – thrive on developing practical, innovative and elegant solutions to complex problems for customers in more than 100 countries. Visit
ashland.com
and
ashland.com/ESG
to learn more.
Forward-Looking Statements
This news release contains forward-looking statements within the meaning of Section 27A of the Securities Act of 1933, as amended and Section 21E of the Securities Exchange Act of 1934, as amended. Ashland has identified some of these forward-looking statements with words such as “anticipates,” “believes,” “expects,” “estimates,” “is likely,” “predicts,” “projects,” “forecasts,” “objectives,” “may,” “will,” “should,” “plans” and “intends” and the negative of these words or other comparable terminology. Ashland may from time to time make forward-looking statements in its annual reports, quarterly reports and other filings with the U.S. Securities and Exchange Commission (“SEC”), news releases and other written and oral communications. These forward-looking statements are based on Ashland’s expectations and assumptions, as of the date such statements are made, regarding Ashland’s future operating performance, financial, operating cash flow and liquidity, as well as the economy and other future events or circumstances. These statements include, but are not limited to, expectations regarding the impact of operating performance on profitability, improved profitability in the fourth quarter, the expansion of technology platforms, Ashland’s ability to maintain improved earnings momentum into fiscal 2027, and management’s perspectives and projections regarding Ashland’s performance in fiscal year 2026.
Ashland’s expectations and assumptions include, without limitation, internal forecasts and analyses of current and future market conditions and trends, management plans and strategies, operating efficiencies and economic conditions (such as prices, supply and demand, cost of raw materials, and the ability to recover raw-material cost increases through price increases), and risks and uncertainties associated with the following: Ashland’s aggressive growth goals and the extent to which such goals may be impacted by a failure to optimize our tangible and intangible assets, a failure to identify and integrate acquisition targets, any unexpected costs and liabilities associated with such acquisitions, and goodwill impairment; business disruptions stemming from natural, operational, and other catastrophic events, including disruptions to supply and logistics functions, manufacturing delays, and information technology system and network failures; climate change and related resource impacts; changes in consumer preferences and a reduction in demand for Ashland’s products; risks inherent in operating a global business, including tariffs and other trade policies, geopolitical instability and armed conflict, and challenges associated with hiring and managing a diverse workforce across countries with differing laws, regulations, and cultural practices; economic downturns and disruptions in the financial markets; Ashland’s substantial indebtedness, including the possibility that such indebtedness and related restrictive covenants may adversely affect our future cash flows, limit our ability to repay debt and obtain future financing, place Ashland at a competitive disadvantage, and make us more vulnerable to interest rate increases; our ability to develop and market new products and remain competitive in the markets in which we operate; our ability to pass increases in the costs of energy and raw materials to customers and to fulfill our contractual requirements with customers and vendors; downward pressures on prices and margins; the ability to attract and retain key employees and to provide for effective succession planning; cybersecurity risks, including disruptions to or failures in Ashland’s information technology systems and networks, malicious cyberattacks, and the inadvertent or accidental disclosure or loss of proprietary or sensitive information; Ashland’s ability to effectively protect and enforce its intellectual property rights; exposure to products liability claims; risks related to compliance with environmental, health, and safety regulations, including the potential for costly litigation, remediation, and settlement actions; exposure to pending and threatened asbestos-related litigation; changes in the legal and regulatory landscapes in which we operate; changes in taxation or adverse tax rulings; and, without limitation, risks and uncertainties affecting Ashland that are described in Ashland’s most recent Annual Report on Form 10-K (including Item 1A Risk Factors) filed with the SEC, which is available on Ashland’s website at http://investor.ashland.com or on the SEC’s website at http://www.sec.gov. Various risks and uncertainties may cause actual results to differ materially from those stated, projected or implied by any forward-looking statements. Ashland believes its expectations and assumptions are reasonable, but there can be no assurance that the expectations reflected herein will be achieved. Unless legally required, Ashland undertakes no obligation to update any forward-looking statements made in this news release whether as a result of new information, future events or otherwise.
1 Financial results are preliminary until Ashland’s Form 10-Q is filed with the U.S. Securities and Exchange Commission.
2 The Ongoing Free Cash Flow metric excludes the impact of inflows and outflows from U.S. and Foreign Accounts Receivable Sales Program and payments related to restructuring and environmental and litigation-related matters in both the current-year and prior-year periods.
™ Trademark, Ashland or its subsidiaries, registered in various countries.
FOR FURTHER INFORMATION:
| Investor Relations: | Media Relations: |
| Sandy Klugman | Carolmarie C. Brown |
| +1 (302) 594-7777 | +1 (302) 995-3158 |
| [email protected] | [email protected] |
Attachments
- Ashland_Q3_ 2026_Earnings_ Release_FNL_20260728
- Ashland_Q3_ 2026_Earnings_ Release_With_Financial_Tables_FNL_20260728
- Ashland_Earnings_ Release_Tables_Q3_FY26_FNL_20260728