


Parsons Corporation reports a 24% year-over-year increase in contract awards, showcasing strategic positioning despite declining revenue and net income.
Quiver AI Summary
Parsons Corporation reported a strong performance for the second quarter of 2026, highlighted by a 24% year-over-year increase in contract awards and a book-to-bill ratio of 1.2x, maintaining a positive trend since its 2019 IPO. The company experienced 10% organic revenue growth in the Middle East, showcasing resilience amid regional conflicts. Despite a slight 1% decrease in overall revenue to $1.6 billion, revenue increased by 8% when excluding certain portfolio-shaping actions. However, net income fell to a loss of $15 million, signifying a $70 million year-over-year decline primarily due to losses from divestitures and joint venture charges. Parsons took strategic steps to focus on sustainable growth and enhance long-term shareholder value, while also revising fiscal year guidance for revenue and adjusted EBITDA downwards. The company remains confident due to its robust backlog of $9.3 billion and continued success in securing key contracts across its segments, particularly in government solutions and infrastructure projects.
Potential Positives
- Continued strong demand demonstrated by a 24% year-over-year increase in contract awards and a book-to-bill ratio of 1.2x, positioning the company for sustained success.
- Significant contract wins in Q2 2026, including a $514 million contract extension with the Missile Defense Agency, which reflects confidence in Parsons’ capabilities.
- Middle East business showed resilience with 10% organic revenue growth and a 1.1x book-to-bill ratio, even amidst regional conflict, highlighting alignment with spending priorities in the region.
- Strong total backlog increased to $9.3 billion, indicating a solid foundation for future revenue growth.
Potential Negatives
- Q2 revenue decreased by 1% year-over-year to $1.6 billion, with a 5% decline on an organic basis, indicating a potential struggle in revenue growth despite an increase in contract awards.
- Net income showed a significant decline, with a loss of $15 million compared to a profit of $55 million in the prior year, highlighting financial challenges faced by the company during this period.
- Adjusted EBITDA decreased by 72% to $42 million, pointing to severe operational inefficiencies and increased costs related to portfolio-shaping actions and joint venture program charges.
FAQ
What were the key financial highlights for Parsons in Q2 2026?
Parsons reported a 24% increase in contract awards, a 1.2x book-to-bill ratio, and total revenue of $1.6 billion.
How did Parsons perform in the Middle East market?
The company achieved 10% organic revenue growth and a 1.1x book-to-bill ratio, showcasing strong demand in that region.
What challenges did Parsons face in its financial results?
Parsons experienced a net loss of $15 million, impacted by charges related to portfolio-shaping actions and operational costs.
What strategic initiatives did Parsons implement?
Parsons took portfolio-shaping actions focused on profitable growth and enhanced risk management to strengthen its market position.
How did Parsons update its fiscal year 2026 guidance?
The company revised its revenue guidance to between $6.2 billion and $6.5 billion, adjusting previous estimates due to market conditions.
Disclaimer: This is an AI-generated summary of a press release distributed by GlobeNewswire. The model used to summarize this release may make mistakes. See the full release here.
$PSN Insider Trading Activity
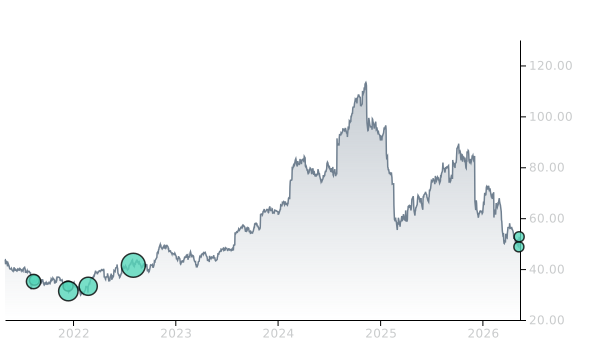
$PSN insiders have traded $PSN stock on the open market 3 times in the past 6 months. Of those trades, 3 have been purchases and 0 have been sales.
Here’s a breakdown of recent trading of $PSN stock by insiders over the last 6 months:
- MARK KEITH HOLDSWORTH has made 2 purchases buying 10,000 shares for an estimated $512,673 and 0 sales.
- GEORGE L. BALL purchased 10,000 shares for an estimated $500,000
To track insider transactions, check out Quiver Quantitative's insider trading dashboard. You can access data on insider stock transactions through the Quiver Quantitative API insider transaction endpoint.
$PSN Revenue
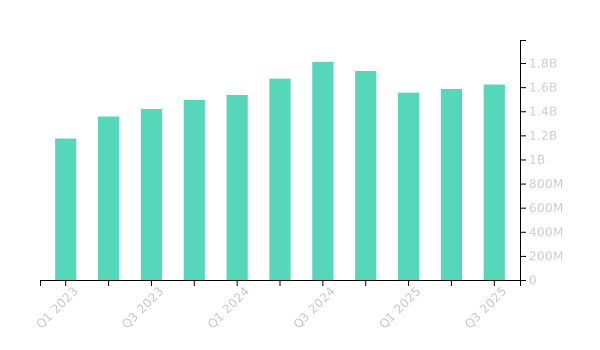
$PSN had revenues of $1.5B in Q1 2026. This is a decrease of -4.06% from the same period in the prior year.
You can track PSN financials on Quiver Quantitative's PSN stock page.
You can access data on PSN stock through the Quiver Quantitative API.
$PSN Hedge Fund Activity
We have seen 146 institutional investors add shares of $PSN stock to their portfolio, and 184 decrease their positions in their most recent quarter.
Here are some of the largest recent moves:
- WELLINGTON MANAGEMENT GROUP LLP added 2,505,359 shares (+364.4%) to their portfolio in Q1 2026, for an estimated $135,715,297
- ARTISAN PARTNERS LIMITED PARTNERSHIP removed 2,377,612 shares (-96.0%) from their portfolio in Q1 2026, for an estimated $128,795,242
- FMR LLC removed 1,331,539 shares (-57.4%) from their portfolio in Q1 2026, for an estimated $72,129,467
- SWEDBANK AB added 1,282,425 shares (+53.7%) to their portfolio in Q2 2026, for an estimated $67,186,245
- FIL LTD removed 913,685 shares (-76.2%) from their portfolio in Q1 2026, for an estimated $49,494,316
- COOPER CREEK PARTNERS MANAGEMENT LLC added 467,672 shares (+1248.6%) to their portfolio in Q1 2026, for an estimated $25,333,792
- MIRAE ASSET GLOBAL ETFS HOLDINGS LTD. added 463,094 shares (+45.4%) to their portfolio in Q1 2026, for an estimated $25,085,801
To track hedge funds' stock portfolios, check out Quiver Quantitative's institutional holdings dashboard. You can access data on hedge funds moves and 13F filings through the Quiver Quantitative API 13F endpoint.
$PSN Price Targets
Multiple analysts have issued price targets for $PSN recently. We have seen 6 analysts offer price targets for $PSN in the last 6 months, with a median target of $71.5.
Here are some recent targets:
- John Godyn from Citigroup set a target price of $66.0 on 07/01/2026
- Tobey Sommer from Truist Securities set a target price of $75.0 on 04/20/2026
- Andrew Wittmann from Baird set a target price of $60.0 on 04/13/2026
- Adam Seiden from Barclays set a target price of $70.0 on 03/31/2026
- Sangita Jain from Keybanc set a target price of $73.0 on 02/12/2026
- Gavin Parsons from UBS set a target price of $95.0 on 02/12/2026
Full Release
Key Takeaways
- Continued strong demand with 24% year-over-year increase in contract awards and a 1.2x book-to-bill ratio for the quarter, positioning the company for continued success
- Middle East resiliency with 10% organic revenue growth and a 1.1x book-to-bill ratio
-
Portfolio-shaping initiatives implemented to prioritize profitable, sustainable growth and enhance long-term shareholder value
Q2 2026 Financial Highlights
- Book-to-bill ratio of 1.2x, exceeded 1.0x in both segments and continued streak of TTM book-to-bill ratio of 1.0x or greater in every quarter since 2019 IPO. Federal Solutions bookings increase 51% year-over-year
- Significant Q2 2026 wins underscore Parsons strategic positioning and technology leadership
- Q2 revenue of $1.6 billion decreased 1% year-over-year and 5% on an organic basis, in-line with expectations
- Revenue growth of 8% excluding confidential contract and portfolio-shaping actions; 3% on an organic basis
- Net income of ($15 million) decreased $70 million year-over-year. Net income was impacted by a net loss of $85 million on programs relating to the company’s portfolio-shaping actions and charges on a joint venture program
- Adjusted EBITDA decreased 72% to $42 million. Excluding $118 million of charges, adjusted EBITDA of $161 million increased 8% year-over-year
- Adjusted EBITDA margin contracted 670 basis points to 2.7%. Excluding the impact of charges, adjusted EBITDA increased 70 basis points to 10.1%
- Total and funded backlog increased to $9.3 billion and $6.6 billion, respectively
-
Revising fiscal year 2026 guidance ranges
CHANTILLY, Va., July 29, 2026 (GLOBE NEWSWIRE) -- Parsons Corporation (NYSE: PSN) today announced financial results for the second quarter ended June 30, 2026.
CEO Commentary
“Our second quarter results highlight the demand for our solutions and the effectiveness of our strategy in a dynamic macro environment,” said Carey Smith, chair, president, and chief executive officer. “Parsons delivered strong book-to-bill ratios in both segments, achieved profitable growth in its core business, and secured strategic contract wins for long-term success. The Middle East business performed exceptionally well despite regional conflict, posting a 1.1x book-to-bill ratio and 10% organic revenue growth, demonstrating strong alignment with regional spending priorities.
During the quarter, Parsons took decisive portfolio-shaping actions to focus on profitable and sustainable growth. These steps, combined with robust risk management and enhanced bid discipline, further strengthen the company’s market position and margin profile. Looking ahead, we believe Parsons’ strong backlog, robust pipeline, high win rates, and differentiated technology capabilities—especially in advanced AI, cyber, and electronic warfare—position the company to drive profitable growth and deliver long-term shareholder value.”
Second Quarter 2026 Results
Year-over-Year Comparisons (Q2 2026 vs. Q2 2025)
Total revenue for the second quarter of 2026 decreased by $8 million, or 1%, to $1.6 billion and was down 5% on an organic basis. Excluding the company's confidential contract and portfolio-shaping actions, total revenue increased 8% and organic revenue increased 3% driven by our Transportation, Space and Missile Defense, and Urban Development markets. Operating income decreased 99% to $1 million primarily due to losses on programs the company plans to divest and charges on a joint venture program. Net income decreased 128% to ($15 million) as a result of these same factors. GAAP diluted earnings per share (EPS) attributable to Parsons was ($0.14) in the second quarter of 2026, compared to $0.50 in the prior year period.
Adjusted EBITDA including noncontrolling interests for the second quarter of 2026 was $42 million, a 72% decrease over the prior year period, reflecting $118 million in charges related to portfolio actions and a joint venture program charge. Adjusted EBITDA margin contracted 670 basis points to 2.7% compared to 9.4% in the second quarter of 2025. These decreases were driven by the items that impacted operating income noted above. Excluding these charges, adjusted EBITDA increased 8% to $161 million and adjusted EBITDA margin expanded 70 basis points to 10.1%. These increases were driven by improved infrastructure margins and contributions from accretive acquisitions. Adjusted diluted EPS was $(0.06) in the second quarter of 2026, compared to $0.78 in the second quarter of 2025. The year-over-year adjusted diluted EPS decrease was driven by the same portfolio and joint venture charges affecting operating income.
Segment Results
Critical Infrastructure Segment
Critical Infrastructure Year-over-Year Comparisons (Q2 2026 vs. Q2 2025)
| Three Months Ended | Growth | Six Months Ended | Growth | |||||||||||||||||||||||||||||
| (in millions) | June 30, 2026 | June 30, 2025 |
Dollars/
Percent |
Percent | June 30, 2026 | June 30, 2025 |
Dollars/
Percent |
Percent | ||||||||||||||||||||||||
| Revenue | $ | 815 | $ | 779 | $ | 36 | 5 | % | $ | 1,548 | $ | 1,491 | $ | 57 | 4 | % | ||||||||||||||||
| Adjusted EBITDA | $ | 56 | $ | 82 | $ | (26 | ) | (32 | )% | $ | 135 | $ | 155 | $ | (20 | ) | (13 | )% | ||||||||||||||
| Adjusted EBITDA margin | 6.9 | % | 10.5 | % | (3.6 | )% | (34 | )% | 8.7 | % | 10.4 | % | (1.7 | )% | (16 | )% | ||||||||||||||||
Second quarter 2026 Critical Infrastructure revenue increased $36 million, or 5%, from the second quarter of 2025. This increase was driven by organic growth of 4% and inorganic revenue contributions from the company's Applied Sciences acquisition. Organic growth was primarily driven by strong performance in the Middle East where revenue grew 10%.
Second quarter 2026 adjusted EBITDA including noncontrolling interests decreased by $26 million, or (32%), compared to the prior year period, and includes $41 million of joint venture-related charges. Adjusted EBITDA margin contracted 360 basis points to 6.9% from 10.5% in the prior year period. Excluding these charges, adjusted EBITDA increased 18% to $97 million and adjusted EBITDA margin expanded 140 bps to 11.9%. These increases were driven by accretive growth in the Middle East and improved mix in North America on higher Parsons’ labor contributions.
Federal Solutions Segment
Federal Solutions Year-over-Year Comparisons (Q2 2026 vs. Q2 2025)
| Three Months Ended | Growth | Six Months Ended | Growth | |||||||||||||||||||||||||||||
| (in millions) | June 30, 2026 | June 30, 2025 |
Dollars/
Percent |
Percent | June 30, 2026 | June 30, 2025 |
Dollars/
Percent |
Percent | ||||||||||||||||||||||||
| Revenue | $ | 761 | $ | 805 | $ | (45 | ) | (6 | )% | $ | 1,519 | $ | 1,648 | $ | (129 | ) | (8 | )% | ||||||||||||||
| Adjusted EBITDA | $ | (14 | ) | $ | 67 | $ | (81 | ) | (121 | )% | $ | 58 | $ | 143 | $ | (85 | ) | (59 | )% | |||||||||||||
| Adjusted EBITDA margin | (1.8 | )% | 8.3 | % | (10.1 | )% | (122 | )% | 3.8 | % | 8.7 | % | (4.9 | )% | (56 | )% | ||||||||||||||||
Second quarter 2026 revenue decreased $45 million, or 6%, compared to the prior year period and 14% on an organic basis. Excluding the company's confidential contract and portfolio-shaping actions, Federal Solutions' revenue increased 11% and 2% on an organic basis. These increases were driven by our Space and Missile Defense and Transportation markets, and contributions from our Altamira and Chesapeake Technologies acquisitions.
Second quarter 2026 Federal Solutions adjusted EBITDA including noncontrolling interests decreased by $81 million, or 121%, compared to the prior year period, and includes $77 million in charges related to programs planned for divestiture. Adjusted EBITDA margin decreased to (1.8%) from 8.3% in the prior year period. Excluding these charges, adjusted EBITDA decreased 5% to $64 million and adjusted EBITDA margin declined 10 bps to 8.2%. These decreases were primarily driven by lower volume on the company's fixed-price confidential contract and higher volume of materials and subcontract efforts diluting margins.
Second Quarter 2026 Key Performance Indicators
- Book-to-bill ratio: 1.2x on net bookings of $1.9 billion.
- Book-to-bill ratio (trailing twelve-months): 1.1x on net bookings of $7.0 billion.
- Total backlog: $9.3 billion, up $314 million from Q2 2025. Funded backlog of $6.6 billion represents 71% of total backlog.
- Cash flow from operating activities: Q2 2026 of $58 million compared to $160 million in second quarter of 2025. Cash flow decreased from the prior year period primarily due to the proactive investment of memory and storage inventory for high-margin, high-demand products aligned with national security priorities, and the timing of customer payments.
Significant Contract Wins
Parsons continues to win new business across both segments. During the second quarter of 2026, the company won five single-award contracts worth more than $100 million each.
- Awarded a two-year, $514 million contract extension under the Missile Defense Agency’s (MDA) Technical, Engineering, Advisory, and Management Support (TEAMS) – Next Systems Engineering contract. This award exercises the second option period and extends Parsons’ more than four-decade partnership with the MDA. Under the contract, Parsons will continue to deliver advanced engineering for the integrated Missile Defense System (MDS). The company booked $195 million on this contract during the second quarter.
- Awarded $400 million in Other Transaction Agreements, each with a three-year period of performance. The company booked $125 million under these contracts during the second quarter. These new OTAs reflect demand for our mission-critical defense and intelligence solutions, and confidence in our ability to rapidly deliver.
- Awarded a five-year, $245 million indefinite delivery, indefinite quantity contract from the U.S. Naval Research Laboratory. Under this contract, Parsons will design, test, maintain, and enhance mission-critical software modules, and provide configuration control and cybersecurity for space and ground systems supporting national security missions. The company booked $71 million under this contract during the second quarter.
- Awarded a new seven-year, single-award indefinite delivery, indefinite quantity contract with a ceiling value of $184 million to support the Department of Navy’s Intelligence Carry-On Program. This contract represents new work for the company and supports the rapid delivery of innovative capabilities that enhance speed and agility for the warfighter. The company booked $26 million on this contract during the second quarter.
- Received an additional $161 million to continue serving as the Main Construction Manager for remediation projects on the Giant Mine program in Canada, known as one of the largest and most complex mine reclamation projects in the world. The company booked the full amount during the second quarter.
- Awarded over $160 million across two classified contracts - one focused on national security and the other on cybersecurity. The company booked $78 million on these contracts during the second quarter.
- Awarded $84 million by the New York City Department of Environmental Protection for the Newtown Creek Combined Sewer Overflow Storage Tunnel project in New York City. Parsons serves as a member of Newtown Creek CSO Partners, a joint venture with AECOM and EPC Consultants Inc., supporting the delivery of a major underground infrastructure program designed to eliminate untreated sewer discharges into local waterways. Under the 16-year program, which represents one of New York City’s most significant wastewater infrastructure investments, Parsons will provide construction management (CM) services for the large-diameter storage tunnel, tunnel dewatering pump station, and other structures, drawing on its experience delivering complex tunnel and sewer programs in dense urban environments. The company booked the full amount during the second quarter.
- Awarded an additional $73 million contract in support of the Air Force Research Laboratory’s Global Application Research, Development, Engineering and Maintenance (GARDEM) mission. The contract is the fourth in support of GARDEM in 2026, bringing Parsons’ total awards to $218 million. Under this contract, Parsons will perform research and development and operations and maintenance (O&M) across GARDEM 2 enterprise platform and mission application software baselines, including Platform and Mission Application support for field sites and existing installations. The company booked $5 million on this contract during the second quarter.
-
During the quarter, U.S. Cyber Command expressed their intent to increase the Joint Cyber Hunt Kit, or JCHK, contract ceiling to $750 million. This is a powerful testament to the company's ability to deliver advanced, deployable hardware and software solutions at scale.
Additional Corporate Highlights
Parsons continues to be recognized as a leading global infrastructure company, receiving multiple awards for project excellence. During the quarter, the company was recognized as a global industry leader for Program Management by Engineering News-Record and received multiple awards from the American Council of Engineering Companies for its innovative solutions. Parsons was also recognized for being a top employer for military veterans.
- Recognized by Engineering News-Record as one of the top three global companies in each of their 2026 rankings: Program Management, Professional Services, and Program/Construction Management for Fee. These rankings reflect the company’s worldwide reputation and ability to successfully win and execute infrastructure programs.
- Received two prestigious 2026 National Recognition Engineering Excellence Awards by the American Council of Engineering Companies (ACEC) for the Gulfport Redevelopment Project at the Gulfport Job Corps Center and the Twin Ports Interchange Final Design. The Twin Ports Interchange project also received a Grand Award and placed third in the Grand Conceptor category in the 2026 ACEC of Minnesota Engineering Excellence Awards.
- Honored with a 2026 Award of Excellence in Steel Construction in the infrastructure category by the Canadian Institute of Steel Construction for the Kicking Horse Canyon Phase 4 project in British Columbia.
- Recognized as a 2026 VETS Indexes 5 Star Employer for its strong commitment to recruiting, hiring, retaining, developing, and supporting veterans and the military-connected community. This marks the fourth consecutive year of VETS Index Employer Awards recognition.
Fiscal Year 2026 Guidance
The company is updating its fiscal year 2026 revenue, adjusted EBITDA, and operating cash flow guidance ranges. The table below summarizes the company’s fiscal year 2026 guidance.
|
Current Fiscal Year
2026 Guidance |
Prior Fiscal Year
2026 Guidance |
|
| Revenue | $6.2 billion - $6.5 billion | $6.5 billion - $6.8 billion |
| Adjusted EBITDA including non-controlling interest | $500 million - $560 million | $615 million - $675 million |
| Cash Flow from Operating Activities | $430 million - $490 million | $470 million - $530 million |
We have not provided a reconciliation of our Adjusted EBITDA guidance because the information needed to reconcile this measure is unavailable due to the inherent difficulty of forecasting the timing or amount of various items that have not yet occurred which may be significant. Additionally, estimating such GAAP measure and providing a meaningful reconciliation for future periods requires a level of precision that is unavailable for these future periods and cannot be accomplished without unreasonable effort.
Conference Call Information
Parsons will host a conference call today, July 29, 2026, at 8:00 a.m. ET to discuss the financial results for its second quarter 2026.
Access to a webcast of the live conference call can be obtained through the Investor Relations section of the company's website ( https://investors.parsons.com ). Those parties interested in participating via telephone may register on the Investor Relations website or by clicking here .
A replay will be available on the company's website approximately two hours after the conference call and continuing for one year.
About Parsons Corporation
Parsons (NYSE: PSN) is a leading disruptive technology provider in the national security and global infrastructure markets, with capabilities across cyber and electronic warfare, space and missile defense, transportation, water and environment, urban development, and critical infrastructure protection. Please visit Parsons.com and follow us on LinkedIn and Facebook to learn how we’re making an impact.
Forward-Looking Statements
This Earnings Release contains forward-looking statements within the meaning of the federal securities laws, including the Private Securities Litigation Reform Act of 1995, which statements involve substantial risks and uncertainties. Forward-looking statements generally relate to future events or our future financial or operating performance. Words or phrases such as “may”, “will”, “should”, “expects”, “plans”, “anticipates”, “could”, “intends”, “target”, “projects”, “contemplates”, “believes”, “estimates”, “predicts”, “potential” or “continue” or the negative of these words or other similar terms or expressions are intended to identify forward-looking statements. Forward-looking statements involve known and unknown risks, uncertainties and other important factors that may cause our actual results, performance or achievements to be materially different from any future results, performance or achievements expressed or implied by the forward-looking statements. Such factors include, without limitation, the factors listed under “Risk Factors” in the Company’s Form 10-K for the year ended December 31, 2025, and subsequent filings with the U.S. Securities and Exchange Commission, as well as the following: any issue that compromises our relationships with the U.S. federal government or its agencies or other state, local or foreign governments or agencies; any issues that damage our professional reputation; changes in governmental priorities that shift expenditures away from agencies or programs that we support; volatility of government budgets and funding; our dependence on the award, maintenance and renewal of long-term government contracts, which are subject to the government’s budgetary approval process; our ability to successfully and timely perform our contractual obligations; the size of our addressable markets and the amount of government spennding on private contractors; failure by us or our employees to obtain and maintain necessary security clearances or certifications; failure to comply with numerous laws and regulations; changes in government procurement, contract or other practices or the adoption by governments of new laws, rules, regulations and programs in a manner adverse to us; the termination or nonrenewal of our government contracts, particularly our contracts with the U.S. federal government; our ability to compete effectively in the competitive bidding process and delays, contract terminations or cancellations caused by competitors’ protests of major contract awards received by us; our ability to generate revenue under certain of our contracts; any inability to attract, train or retain employees with the requisite skills, experience and security clearances; the loss of members of senior management or failure to develop new leaders; underperformance, misconduct or other improper activities of our employees or subcontractors; our ability to realize the full value of our backlog and the timing of our receipt of revenue under contracts included in backlog; changes in the mix of our contracts, including the impact of contract divestments and program exits, and our ability to accurately estimate or otherwise recover expenses, time and resources for our contracts; changes in estimates used in recognizing revenue; internal system or service failures and cyber or other security breaches; and inherent uncertainties and potential adverse developments in legal proceedings including litigation, audits, reviews and investigations, which may result in materially adverse judgments, settlements or other unfavorable outcomes.
Forward-looking statements are primarily based on our current estimates, assumptions, expectations and projections. These forward-looking statements are not guarantees of future performance and are subject to risks, uncertainties and other factors, many of which are beyond our control and difficult to predict. All forward-looking statements are based on currently available information and speak only as of the date on which they are made. These statements are inherently uncertain, and you are cautioned not to unduly rely upon these statements. We undertake no obligation to update any forward-looking statements to subsequent events, new information or otherwise, except as required in connection with our ongoing requirements under federal securities laws.
| Media: | Investor Relations: |
| Bryce McDevitt | Dave Spille |
| Parsons Corporation | Parsons Corporation |
| (703) 851-4425 | (571) 775-0408 |
| [email protected] | [email protected] |
PARSONS CORPORATION
CONSOLIDATED STATEMENTS OF OPERATIONS
(In thousands, except per share data)
(Unaudited)
| Three Months Ended | Six Months Ended | |||||||||||||||
| June 30, 2026 | June 30, 2025 | June 30, 2026 | June 30, 2025 | |||||||||||||
| Revenue | $ | 1,575,867 | $ | 1,584,323 | $ | 3,067,043 | $ | 3,138,683 | ||||||||
| Direct cost of contracts | 1,280,629 | 1,235,970 | 2,414,385 | 2,436,347 | ||||||||||||
| Equity in losses of unconsolidated joint ventures | (33,748 | ) | (642 | ) | (27,592 | ) | (1,329 | ) | ||||||||
| Selling, general and administrative expenses | 260,195 | 252,050 | 528,097 | 496,113 | ||||||||||||
| Operating income | 1,295 | 95,661 | 96,969 | 204,894 | ||||||||||||
| Interest income | 565 | 1,068 | 2,376 | 3,210 | ||||||||||||
| Interest expense | (16,386 | ) | (12,569 | ) | (32,384 | ) | (24,815 | ) | ||||||||
| Other income, net | 18,283 | 5,019 | 18,094 | 6,654 | ||||||||||||
| Total other income (expense) | 2,462 | (6,482 | ) | (11,914 | ) | (14,951 | ) | |||||||||
| Income before income tax expense | 3,757 | 89,179 | 85,055 | 189,943 | ||||||||||||
| Income tax benefit (expense) | (4,222 | ) | (18,690 | ) | (20,309 | ) | (37,667 | ) | ||||||||
| Net (loss) income including noncontrolling interests | (465 | ) | 70,489 | 64,746 | 152,276 | |||||||||||
| Net income attributable to noncontrolling interests | (14,754 | ) | (15,259 | ) | (27,039 | ) | (30,843 | ) | ||||||||
| Net (loss) income attributable to Parsons Corporation | $ | (15,219 | ) | $ | 55,230 | $ | 37,707 | $ | 121,433 | |||||||
| Earnings per share: | ||||||||||||||||
| Basic | $ | (0.14 | ) | $ | 0.52 | $ | 0.35 | $ | 1.14 | |||||||
| Diluted | $ | (0.14 | ) | $ | 0.50 | $ | 0.35 | $ | 1.10 | |||||||
Weighted average number shares used to compute basic and diluted EPS
(In thousands) (Unaudited)
| Three Months Ended | Six Months Ended | |||||||||||||||
| June 30, 2026 | June 30, 2025 | June 30, 2026 | June 30, 2025 | |||||||||||||
| Basic weighted average number of shares outstanding | 106,982 | 106,997 | 107,082 | 106,914 | ||||||||||||
| Dilutive effect of stock-based awards | 700 | 1,205 | 918 | 1,414 | ||||||||||||
| Dilutive effect of warrants | - | 7 | 14 | 223 | ||||||||||||
| Dilutive effect of convertible senior notes | - | 1,893 | - | 2,006 | ||||||||||||
| Diluted weighted average number of shares outstanding | 107,682 | 110,102 | 108,014 | 110,557 | ||||||||||||
Net income available to shareholders used to compute diluted EPS as a result of adopting the if-converted method in connection with the Convertible Senior Notes
(In thousands)
(
Unaudited
)
| Three Months Ended | Six Months Ended | |||||||||||||||
| June 30, 2026 | June 30, 2025 | June 30, 2026 | June 30, 2025 | |||||||||||||
| Net (loss) income attributable to Parsons Corporation | $ | (15,219 | ) | $ | 55,230 | $ | 37,707 | $ | 121,433 | |||||||
| Convertible senior notes if-converted method interest adjustment | - | 54 | - | 108 | ||||||||||||
| Diluted net (loss) income attributable to Parsons Corporation | $ | (15,219 | ) | $ | 55,284 | $ | 37,707 | $ | 121,541 | |||||||
PARSONS CORPORATION
CONSOLIDATED BALANCE SHEETS
(In thousands, except share information)
| June 30, 2026 | December 31, 2025 | ||||||||
| Assets | |||||||||
| Current assets: | |||||||||
| Cash and cash equivalents (including $79,806 and $153,144 Cash of consolidated joint ventures) | $ | 266,044 | $ | 466,388 | |||||
| Accounts receivable, net (including $356,033 and $337,270 Accounts receivable of consolidated joint ventures) | 1,146,226 | 1,124,417 | |||||||
| Contract assets (including $48,953 and $41,318 Contract assets of consolidated joint ventures) | 1,062,280 | 915,806 | |||||||
| Prepaid expenses and other current assets (including $16,942 and $11,145 Prepaid expenses and other current assets of consolidated joint ventures) | 228,495 | 176,932 | |||||||
| Assets held for sale | 17,233 | - | |||||||
| Total current assets | 2,720,278 | 2,683,543 | |||||||
| Property and Equipment, net (including $2,334 and $2,488 Property and equipment of consolidated joint ventures) | 159,507 | 151,061 | |||||||
| Right of use assets, operating leases (including $3,744 and $4,482 Right of use assets, operating leases of consolidated joint ventures) | 147,854 | 126,770 | |||||||
| Goodwill | 2,421,427 | 2,186,650 | |||||||
| Investments in and advances to unconsolidated joint ventures | 153,328 | 148,640 | |||||||
| Intangible assets, net | 384,179 | 325,880 | |||||||
| Deferred tax assets | 61,077 | 88,191 | |||||||
| Other noncurrent assets | 59,296 | 58,799 | |||||||
| Total assets | $ | 6,106,946 | $ | 5,769,534 | |||||
| Liabilities and Shareholders' Equity | |||||||||
| Current liabilities: | |||||||||
| Accounts payable (including $49,525 and $58,914 Accounts payable of consolidated joint ventures) | $ | 246,895 | $ | 250,514 | |||||
| Accrued expenses and other current liabilities (including $184,251 and $195,747 Accrued expenses and other current liabilities of consolidated joint ventures) | 940,534 | 884,445 | |||||||
| Contract liabilities (including $44,283 and $44,802 Contract liabilities of consolidated joint ventures) | 346,576 | 340,113 | |||||||
| Short-term lease liabilities, operating leases (including $2,041 and $2,395 Short-term lease liabilities, operating leases of consolidated joint ventures) | 40,308 | 45,353 | |||||||
| Income taxes payable | 2,102 | 11,239 | |||||||
| Liabilities held for sale | 60,725 | - | |||||||
| Total current liabilities | 1,637,140 | 1,531,664 | |||||||
| Long-term employee incentives | 26,923 | 30,834 | |||||||
| Long-term debt | 1,474,048 | 1,237,816 | |||||||
| Long-term lease liabilities, operating leases (including $1,699 and $2,083 Long-term lease liabilities, operating leases of consolidated joint ventures) | 120,296 | 94,044 | |||||||
| Deferred tax liabilities | 10,076 | 12,159 | |||||||
| Other long-term liabilities | 90,694 | 95,345 | |||||||
| Total liabilities | $ | 3,359,177 | $ | 3,001,862 | |||||
| Contingencies (Note 12) | |||||||||
| Shareholders' equity: | |||||||||
| Common stock, $1 par value; authorized 1,000,000,000 shares; 145,506,001 and 145,676,335 shares issued; 57,556,643 and 56,103,965 public shares outstanding; 49,241,105 and 50,864,117 ESOP shares outstanding | $ | 145,506 | $ | 145,676 | |||||
| Treasury stock, 38,708,253 shares at cost | (793,002 | ) | (792,638 | ) | |||||
| Additional paid-in capital | 2,611,828 | 2,648,730 | |||||||
| Retained earnings | 694,530 | 661,173 | |||||||
| Accumulated other comprehensive loss | (27,443 | ) | (20,921 | ) | |||||
| Total Parsons Corporation shareholders' equity | 2,631,419 | 2,642,020 | |||||||
| Noncontrolling interests | 116,350 | 125,652 | |||||||
| Total shareholders' equity | 2,747,769 | 2,767,672 | |||||||
| Total liabilities and shareholders' equity | $ | 6,106,946 | $ | 5,769,534 | |||||
PARSONS CORPORATION
CONSOLIDATED STATEMENTS OF CASH FLOWS
(In thousands)
(Unaudited)
| For the Six Months Ended | |||||||||
| June 30, 2026 | June 30, 2025 | ||||||||
| Cash flows from operating activities: | |||||||||
| Net income including noncontrolling interests | $ | 64,746 | $ | 152,276 | |||||
| Adjustments to reconcile net income to net cash used in operating activities | |||||||||
| Depreciation and amortization | 72,563 | 55,995 | |||||||
| Amortization of debt issue costs | 2,446 | 2,611 | |||||||
| Loss (gain) on disposal of property and equipment | 1,000 | 63 | |||||||
| Loss (gain) on sale of business | (19,300 | ) | - | ||||||
| Deferred taxes | 1,921 | 2,225 | |||||||
| Foreign currency transaction gains and losses | 1,800 | (5,171 | ) | ||||||
| Equity in losses (earnings) of unconsolidated joint ventures | 27,592 | 1,329 | |||||||
| Return on investments in unconsolidated joint ventures | 13,062 | 15,907 | |||||||
| Stock-based compensation | 22,401 | 22,926 | |||||||
| Contributions of treasury stock | 39,130 | 35,382 | |||||||
|
Changes in assets and liabilities, net of acquisitions and consolidated
joint ventures: |
|||||||||
| Accounts receivable | (5,478 | ) | (31,905 | ) | |||||
| Contract assets | (157,998 | ) | (84,802 | ) | |||||
| Prepaid expenses and other assets | (55,126 | ) | (7,544 | ) | |||||
| Accounts payable | (7,266 | ) | 62,462 | ||||||
| Accrued expenses and other current liabilities | 15,022 | (94,320 | ) | ||||||
| Contract liabilities | 68,430 | 14,472 | |||||||
| Income taxes | (10,217 | ) | 5,828 | ||||||
| Other long-term liabilities | (20,844 | ) | 280 | ||||||
| Net cash provided by operating activities | 53,884 | 148,014 | |||||||
| Cash flows from investing activities: | |||||||||
| Capital expenditures | (31,053 | ) | (22,909 | ) | |||||
| Proceeds from sale of property and equipment | - | 35 | |||||||
| Proceeds from sale of business | 23,966 | - | |||||||
| Payments for acquisitions, net of cash acquired | (330,123 | ) | (117,858 | ) | |||||
| Investments in unconsolidated joint ventures | (56,859 | ) | (35,496 | ) | |||||
| Return of investments in unconsolidated joint ventures | 7,578 | 11,920 | |||||||
| Net cash used in investing activities | (386,491 | ) | (164,308 | ) | |||||
| Cash flows from financing activities: | |||||||||
| Proceeds from borrowings under credit agreement | 454,900 | 243,700 | |||||||
| Repayments of borrowings under credit agreement | (220,900 | ) | (243,700 | ) | |||||
| Repurchases of convertible notes due 2025 | - | (28,486 | ) | ||||||
| Proceeds from term loan | - | 450,000 | |||||||
| Repayment of delayed draw term loan | - | (350,000 | ) | ||||||
| Payments for debt issuance costs | - | (2,571 | ) | ||||||
| Contributions by noncontrolling interests | 234 | 327 | |||||||
| Distributions to noncontrolling interests | (36,575 | ) | (45,055 | ) | |||||
| Repurchases of common stock | (49,989 | ) | (39,994 | ) | |||||
| Taxes paid on vested stock | (19,932 | ) | (18,210 | ) | |||||
| Redemption of warrants | (4 | ) | - | ||||||
| Proceeds from issuance of common stock | 5,700 | 4,796 | |||||||
| Net cash (used in) provided by financing activities | 133,434 | (29,193 | ) | ||||||
| Effect of exchange rate changes | (1,171 | ) | 3,266 | ||||||
| Net increase (decrease) in cash, cash equivalents, and restricted cash | (200,344 | ) | (42,221 | ) | |||||
| Cash, cash equivalents and restricted cash: | |||||||||
| Beginning of year | 466,388 | 453,548 | |||||||
| End of period | $ | 266,044 | $ | 411,327 | |||||
Contract Awards
(in thousands)
| Three Months Ended | Six Months Ended | |||||||||||||||
| June 30, 2026 | June 30, 2025 | June 30, 2026 | June 30, 2025 | |||||||||||||
| Federal Solutions | $ | 985,300 | $ | 650,770 | $ | 2,016,634 | $ | 1,395,479 | ||||||||
| Critical Infrastructure | $ | 883,666 | 855,275 | 1,910,741 | 1,877,072 | |||||||||||
| Total Awards | $ | 1,868,966 | $ | 1,506,045 | $ | 3,927,375 | $ | 3,272,551 | ||||||||
Backlog
(in thousands)
| June 30, 2026 | June 30, 2025 | |||||||
| Federal Solutions: | ||||||||
| Funded | $ | 1,868,875 | $ | 1,816,590 | ||||
| Unfunded | 2,636,203 | 2,656,547 | ||||||
| Total Federal Solutions | 4,505,078 | 4,473,137 | ||||||
| Critical Infrastructure: | ||||||||
| Funded | 4,712,089 | 4,421,015 | ||||||
| Unfunded | 39,726 | 48,886 | ||||||
| Total Critical Infrastructure | 4,751,815 | 4,469,901 | ||||||
| Total Backlog | $ | 9,256,893 | $ | 8,943,038 | ||||
Book-To-Bill Ratio 1 :
| Three Months Ended | Six Months Ended | |||||||||||||||
| June 30, 2026 | June 30, 2025 | June 30, 2026 | June 30, 2025 | |||||||||||||
| Federal Solutions | 1.3 | 0.8 | 1.3 | 0.8 | ||||||||||||
| Critical Infrastructure | 1.1 | 1.1 | 1.2 | 1.3 | ||||||||||||
| Overall | 1.2 | 1.0 | 1.3 | 1.0 | ||||||||||||
1
Book-to-Bill ratio is calculated as total contract awards divided by total revenue for the period.
Non-GAAP Financial Information
The tables under "Parsons Corporation Inc. Reconciliation of Non-GAAP Measures" present Adjusted Net Income attributable to Parsons Corporation, Adjusted Earnings per Share, Earnings before Interest, Taxes, Depreciation, and Amortization (“EBITDA”), Adjusted EBITDA, EBITDA Margin, and Adjusted EBITDA Margin, reconciled to their most directly comparable GAAP measure. These financial measures are calculated and presented on the basis of methodologies other than in accordance with U.S. generally accepted accounting principles ("Non-GAAP Measures"). Parsons has provided these Non-GAAP Measures to adjust for, among other things, the impact of amortization expenses related to our acquisitions, costs associated with a loss or gain on the disposal or sale of property, plant and equipment, restructuring and related expenses, costs associated with mergers and acquisitions, software implementation costs, legal and settlement costs, and other costs considered non-operational in nature. These items have been Adjusted because they are not considered core to the company’s business or otherwise not considered operational or because these charges are non-cash or non-recurring. The company presents these Non-GAAP Measures because management believes that they are meaningful to understanding Parsons’s performance during the periods presented and the company’s ongoing business. Non-GAAP Measures are not prepared in accordance with GAAP and therefore are not necessarily comparable to similarly titled metrics or the financial results of other companies. These Non-GAAP Measures should be considered a supplement to, not a substitute for, or superior to, the corresponding financial measures calculated in accordance with GAAP.
Normalized Financial Measures
In addition to the Non-GAAP Measures described above, for the second quarter of 2026, the company presents normalized Revenue, Net Income, Earnings Per Share (“EPS”), and Operating Cash Flow, each reconciled to its most directly comparable GAAP measure. The company also presents for the second quarter of 2026, normalized Adjusted EBITDA, Adjusted EBITDA Margin, Adjusted Net Income, and Adjusted EPS – Diluted, each of which is a non-GAAP Measure and is reconciled to the measure’s customary Non-GAAP presentation. These normalization adjustments exclude the effects of the portfolio-shaping actions and joint venture charges, as applicable and further described in this Earnings Release and the following reconciliation tables, which management does not consider indicative of the company’s core operating performance for the period presented. These adjustments may include non-recurring or unusual charges and gains, asset impairments, and other items that are not expected to occur regularly as part of the company’s normal operations. Management believes that excluding the effect of such items provides investors with supplemental information that facilitates period-to-period comparisons of operating performance and enhances an understanding of the company’s underlying business trends. These normalized financial measures should not be considered in isolation or as a substitute for, superior to, or more meaningful than their corresponding GAAP or customary non-GAAP financial measures, and may not be comparable to similarly titled measures used by other companies.
PARSONS CORPORATION
Non-GAAP Financial Information
Reconciliation of Net Income to Adjusted EBITDA
(in thousands)
| Three Months Ended | Six Months Ended | |||||||||||||||
| June 30, 2026 | June 30, 2025 | June 30, 2026 | June 30, 2025 | |||||||||||||
| Net income attributable to Parsons Corporation | $ | (15,219 | ) | $ | 55,230 | $ | 37,707 | $ | 121,433 | |||||||
| Interest expense, net | 15,821 | 11,501 | 30,008 | 21,605 | ||||||||||||
| Income tax expense | 4,222 | 18,690 | 20,309 | 37,667 | ||||||||||||
| Depreciation and amortization (a) | 36,637 | 28,592 | 72,563 | 55,995 | ||||||||||||
| Net income attributable to noncontrolling interests | 14,754 | 15,259 | 27,039 | 30,843 | ||||||||||||
| Equity-based compensation | 10,077 | 11,519 | 19,531 | 18,622 | ||||||||||||
| Transaction-related costs (b) | (7,126 | ) | 5,135 | 1,313 | 8,836 | |||||||||||
| Restructuring (c) | - | 2,361 | - | 2,361 | ||||||||||||
| Other (d) | (16,946 | ) | 844 | (15,321 | ) | 545 | ||||||||||
| Adjusted EBITDA | $ | 42,220 | $ | 149,131 | $ | 193,149 | $ | 297,907 | ||||||||
(a) Depreciation and amortization for the three and six months ended June 30, 2026, is $27.5 million and $54.4 million, respectively in the Federal Solutions Segment and $9.1 million and $18.1 million, respectively in the Critical Infrastructure Segment. Depreciation and amortization for the three and six months ended June 30, 2025, is $20.1 million and $39.6 million, respectively in the Federal Solutions Segment and $8.5 million and $16.4 million, respectively in the Critical Infrastructure Segment.
(b) Reflects costs incurred in connection with acquisitions and other non-recurring transaction costs, primarily fees paid for professional services and employee retention.
(c) Reflects costs associated with and related to our corporate restructuring initiatives.
(d) Includes a combination of gain on sale of business, gain/loss related to sale of fixed assets, software implementation costs, and other individually insignificant items that are non-recurring in nature.
PARSONS CORPORATION
Non-GAAP Financial Information
Computation of Adjusted EBITDA Attributable to Noncontrolling Interests
(in thousands)
| Three Months Ended | Six Months Ended | |||||||||||||||
| June 30, 2026 | June 30, 2025 | June 30, 2026 | June 30, 2025 | |||||||||||||
| Federal Solutions Adjusted EBITDA attributable to Parsons Corporation | $ | (13,786 | ) | $ | 67,072 | $ | 57,767 | $ | 142,604 | |||||||
| Federal Solutions Adjusted EBITDA attributable to noncontrolling interests | 23 | 11 | 40 | 62 | ||||||||||||
| Federal Solutions Adjusted EBITDA including noncontrolling interests | $ | (13,763 | ) | $ | 67,083 | $ | 57,807 | $ | 142,666 | |||||||
| Critical Infrastructure Adjusted EBITDA attributable to Parsons Corporation | 41,007 | 66,193 | 107,908 | 124,380 | ||||||||||||
| Critical Infrastructure Adjusted EBITDA attributable to noncontrolling interests | 14,976 | 15,855 | 27,434 | 30,861 | ||||||||||||
| Critical Infrastructure Adjusted EBITDA including noncontrolling interests | $ | 55,983 | $ | 82,048 | $ | 135,342 | $ | 155,241 | ||||||||
| Total Adjusted EBITDA including noncontrolling interests | $ | 42,220 | $ | 149,131 | $ | 193,149 | $ | 297,907 | ||||||||
PARSONS CORPORATION
Non-GAAP Financial Information
Reconciliation of Net Income Attributable to Parsons Corporation to Adjusted Net Income Attributable to Parsons Corporation
(in thousands, except per share information)
| Three Months Ended | Six Months Ended | |||||||||||||||
| June 30, 2026 | June 30, 2025 | June 30, 2026 | June 30, 2025 | |||||||||||||
| Net income attributable to Parsons Corporation | $ | (15,219 | ) | $ | 55,230 | $ | 37,707 | $ | 121,433 | |||||||
| Acquisition related intangible asset amortization | 23,680 | 17,054 | 47,477 | 33,435 | ||||||||||||
| Equity-based compensation | 10,077 | 11,519 | 19,531 | 18,622 | ||||||||||||
| Transaction-related costs (a) | (7,126 | ) | 5,135 | 1,313 | 8,836 | |||||||||||
| Restructuring (b) | - | 2,361 | - | 2,361 | ||||||||||||
| Other (c) | (16,946 | ) | 844 | (15,321 | ) | 545 | ||||||||||
| Tax effect on adjustments | (1,296 | ) | (7,865 | ) | (11,905 | ) | (16,406 | ) | ||||||||
| Adjusted net income attributable to Parsons Corporation | $ | (6,830 | ) | $ | 84,278 | $ | 78,802 | $ | 168,826 | |||||||
| Adjusted earnings per share: | ||||||||||||||||
| Weighted-average number of basic shares outstanding | 106,982 | 106,997 | 107,082 | 106,914 | ||||||||||||
| Weighted-average number of diluted shares outstanding (d) | 107,682 | 108,202 | 108,000 | 108,328 | ||||||||||||
| Adjusted net income attributable to Parsons Corporation per basic share | $ | (0.06 | ) | $ | 0.79 | $ | 0.74 | $ | 1.58 | |||||||
| Adjusted net income attributable to Parsons Corporation per diluted share | $ | (0.06 | ) | $ | 0.78 | $ | 0.73 | $ | 1.56 | |||||||
(a) Reflects costs incurred in connection with acquisitions and other non-recurring transaction costs, primarily fees paid for professional services and employee retention.
(b) Reflects costs associated with and related to our corporate restructuring initiatives.
(c) Includes a combination of gain on sale of business, gain/loss related to sale of fixed assets, software implementation costs, and other individually insignificant items that are non-recurring in nature.
(d) Excludes dilutive effect of convertible senior notes due 2025 due to bond hedge.
PARSONS CORPORATION
Non-GAAP Financial Information
Reconciliation of Reported GAAP Results to Adjusted Results on a Normalized Basis
(a)
(in thousands, except per share information)
|
Q2 2026
As Reported (GAAP) |
Federal Charge
and Divestitures |
Infrastructure
JV Charge |
Q2 2026
Adjusted Results (non-GAAP) |
|||||||||||||
| Federal Solutions revenue | $ | 760,868 | $ | 16,810 | $ | - | $ | 777,678 | ||||||||
| Critical Infrastructure revenue | 814,999 | - | - | 814,999 | ||||||||||||
| Total Revenue | $ | 1,575,867 | $ | 16,810 | $ | - | $ | 1,592,677 | ||||||||
| Net (loss) income attributable to Parsons Corporation | $ | (15,219 | ) | $ | 49,861 | $ | 35,086 | $ | 69,728 | |||||||
| Earnings per share: | ||||||||||||||||
| Basic | $ | (0.14 | ) | $ | 0.46 | $ | 0.33 | $ | 0.65 | |||||||
| Operating Cash Flow | $ | 57,584 | $ | - | $ | - | $ | 57,584 | ||||||||
(a) Reconciliation incorporates a $19.3 million pre-tax gain from the divestiture of two SETA contracts, a $77.5 million pre-tax loss on two contracts which are held for sale, and a $40.9 million pre-tax charge to equity in earnings on a project affected by historic rainfall and program delays in Q2 2026 being performed as part of a joint venture.
PARSONS CORPORATION
Non-GAAP Financial Information
Reconciliation of Adjusted EBITDA, Net Income and EPS on a Normalized Basis
(a)
(in thousands, except per share information)
|
Q2 2026
As Reported |
Federal Charge |
Infrastructure
JV Charge |
Q2 2026
Adjusted Results (non-GAAP) |
|||||||||||||
|
Federal Solutions Adjusted EBITDA
including noncontrolling interests |
$ | (13,763 | ) | $ | 77,535 | $ | - | $ | 63,772 | |||||||
|
Critical Infrastructure Adjusted EBITDA
including noncontrolling interests |
55,983 | - | 40,893 | 96,876 | ||||||||||||
|
Total Adjusted EBITDA
including noncontrolling interests |
$ | 42,220 | $ | 77,535 | $ | 40,893 | $ | 160,648 | ||||||||
| Margin | 2.7 | % | 10.1 | % | ||||||||||||
| Adjusted net income attributable to Parsons Corporation | $ | (6,830 | ) | $ | 64,509 | $ | 35,086 | $ | 92,765 | |||||||
| Adjusted Earnings per share: | ||||||||||||||||
| Diluted | $ | (0.06 | ) | $ | 0.60 | $ | 0.33 | $ | 0.86 | |||||||
(a) Reconciliation incorporates a $77.5 million pre-tax loss on two contracts which are held for sale, and a $40.9 million pre-tax charge to equity in earnings on a project affected by historic rainfall and program delays in Q2 2026 being performed as part of a joint venture.