



Burning Rock Biotech Limited reported a 9.3% revenue decrease in Q2 2026, with significant product updates and ongoing financial challenges.
Quiver AI Summary
Burning Rock Biotech Limited reported its financial results for the second quarter of 2026, indicating a sequential recovery from a challenging first quarter. Revenues fell by 9.3% year-over-year to RMB134.7 million (US$19.9 million), with declines primarily in its central laboratory and pharma research and development segments, while in-hospital business revenues grew by 7.4%. The company highlighted advances in regulatory processes, with its OncoScreen® BCMatch Tissue Kit entering a Priority Review Channel and other products undergoing special review procedures. Operating expenses decreased as the company focused on efficiency, while net loss expanded to RMB18.4 million. Despite these challenges, Burning Rock expressed confidence in achieving long-term growth due to upcoming product registrations and operational improvements. As of June 30, 2026, the company reported RMB419.1 million in cash and equivalents.
Potential Positives
- Burning Rock's OncoScreen® BCMatch Tissue Kit has entered the Priority Review Channel of the CMDE, which could expedite its path to market and indicate strong regulatory support.
- The CanCatch Custom Kit and CanCatch Custom Kit (cPAS) are now in the Special Review Procedure for Innovative Medical Devices, suggesting recognition of their innovative potential.
- The company is experiencing a sequential recovery in revenue after a challenging first quarter, indicating potential for improved financial performance moving forward.
- The gross margin for the in-hospital business increased to 77.1%, reflecting improved sales and a focus on high-margin products.
Potential Negatives
- Revenues decreased by 9.3% compared to the same period in 2025, indicating a negative growth trend.
- Net loss increased to RMB18.4 million for the quarter, compared to RMB9.7 million for the same period in 2025, highlighting worsening financial performance.
- Significant decrease in revenue from pharma research and development services by 31.8%, indicating challenges in this core business area.
FAQ
What are the latest financial results for Burning Rock Biotech?
For the three months ended June 30, 2026, the revenue was RMB134.7 million, a 9.3% decrease from 2025.
What products entered the Priority Review Channel?
The OncoScreen® BCMatch Tissue Kit entered the Priority Review Channel of the CMDE under the NMPA.
How has the in-hospital business performed in Q2 2026?
The in-hospital business generated RMB67.1 million, a 7.4% increase from the same period in 2025.
What was the net loss reported for the second quarter?
The net loss for the three months ended June 30, 2026, was RMB18.4 million, compared to RMB9.7 million from 2025.
What is Burning Rock's mission?
Burning Rock's mission is to guard life via science, focusing on next-generation sequencing technology in precision oncology.
Disclaimer: This is an AI-generated summary of a press release distributed by GlobeNewswire. The model used to summarize this release may make mistakes. See the full release here.
$BNR Insider Trading Activity
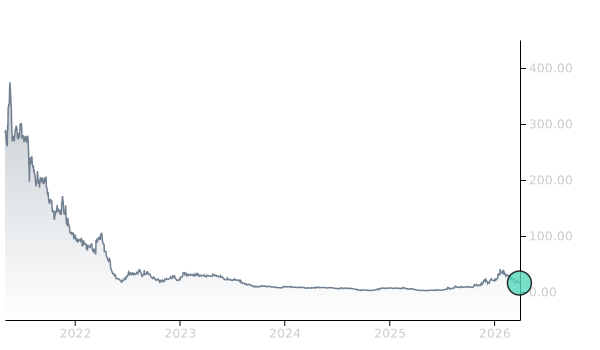
$BNR insiders have traded $BNR stock on the open market 8 times in the past 6 months. Of those trades, 8 have been purchases and 0 have been sales.
Here’s a breakdown of recent trading of $BNR stock by insiders over the last 6 months:
- YUSHENG HAN has made 8 purchases buying 1,046,280 shares for an estimated $11,648,314 and 0 sales.
To track insider transactions, check out Quiver Quantitative's insider trading dashboard. You can access data on insider stock transactions through the Quiver Quantitative API insider transaction endpoint.
$BNR Hedge Fund Activity
We have seen 10 institutional investors add shares of $BNR stock to their portfolio, and 7 decrease their positions in their most recent quarter.
Here are some of the largest recent moves:
- CRCM LP removed 209,329 shares (-42.6%) from their portfolio in Q1 2026, for an estimated $3,376,476
- PROSPERA FINANCIAL SERVICES INC removed 31,185 shares (-100.0%) from their portfolio in Q1 2026, for an estimated $503,014
- MORGAN STANLEY added 28,322 shares (+185.5%) to their portfolio in Q2 2026, for an estimated $237,055
- CITADEL ADVISORS LLC added 17,669 shares (+inf%) to their portfolio in Q1 2026, for an estimated $285,000
- UBS GROUP AG added 17,508 shares (+4291.2%) to their portfolio in Q2 2026, for an estimated $146,541
- RENAISSANCE TECHNOLOGIES LLC added 17,431 shares (+49.2%) to their portfolio in Q2 2026, for an estimated $145,897
- ALMANACK INVESTMENT PARTNERS, LLC. added 16,198 shares (+inf%) to their portfolio in Q2 2026, for an estimated $135,577
To track hedge funds' stock portfolios, check out Quiver Quantitative's institutional holdings dashboard. You can access data on hedge funds moves and 13F filings through the Quiver Quantitative API 13F endpoint.
Full Release
GUANGZHOU, China, Sept. 10, 2026 (GLOBE NEWSWIRE) -- Burning Rock Biotech Limited (NASDAQ: BNR, the “Company” or “Burning Rock”), a company focused on the application of next-generation sequencing (NGS) technology in the field of precision oncology, today reported financial results for the three months ended June 30, 2026.
Recent Business Updates
-
Therapy Selection & MRD
- OncoScreen® BCMatch Tissue Kit has officially entered the Priority Review Channel of the Center for Medical Device Evaluation (CMDE) under the NMPA.
- CanCatch Custom Kit and CanCatch Custom Kit (cPAS) have officially entered the Special Review Procedure for Innovative Medical Devices of CMDE under the NMPA.
- In August 2026, the Priority Review Channel application for OncoCompass Target Cancer Mutation Profiling Liquid Kit was resubmitted and subsequently accepted for review.
“After navigating a challenging first quarter, we delivered the anticipated sequential recovery in the second quarter, offsetting the order volatility in the first quarter,” said Mr. Yusheng Han, Chairman and Chief Executive Officer of Burning Rock. “With several products having entered the Priority Review Channel and Special Review Procedure for Innovative Medical Devices of CMDE and new registration certificates expected in the coming quarters, we are confident that we will achieve sustainable and meaningful top‑line growth over the long term.”
Second Quarter 2026 Financial Results
Revenues were RMB134.7 million (US$19.9 million) for the three months ended June 30, 2026, representing a 9.3% decrease from RMB148.5 million for the same period in 2025.
- Revenue generated from central laboratory business was RMB36.8 million (US$5.4million) for the three months ended June 30, 2026, representing a 10.0% decrease from RMB40.9 million for the same period in 2025, primarily attributable to a decrease in the number of tests, as we continued our transition towards in-hospital business.
- Revenue generated from in-hospital business was RMB67.1 million (US$9.9 million) for the three months ended June 30, 2026, representing a 7.4% increase from RMB62.5 million for the same period in 2025, driven by an increase in sales volume.
-
Revenue generated from pharma research and development services was RMB30.8 million (US$4.6 million) for the three months ended June 30, 2026, representing a 31.8% decrease from RMB45.1 million for the same period in 2025, primarily attributable to decreased testing services performed for our pharma customers.
Cost of revenues was RMB36.9 million (US$5.5 million) for the three months ended June 30, 2026, representing an 8.6% decrease from RMB40.4 million for the same period in 2025.
Gross profit was RMB97.8 million (US$14.4 million) for the three months ended June 30, 2026, representing a 9.5% decrease from RMB108.1 million for the same period in 2025. Gross margin was 72.6% for the three months ended June 30, 2026, compared to 72.8% for the same period in 2025. By channel, gross margin of central laboratory business was 85.7% for the three months ended June 30, 2026, compared to 87.9% during the same period in 2025, primarily driven by an increased depreciation; gross margin of in-hospital business was 77.1% for the three months ended June 30, 2026, compared to 74.4% during the same period in 2025, primarily attributable to an increase in sales volume to high margin products; gross margin of pharma research and development services was 47.2% for the three months ended June 30, 2026, compared to 56.8% during the same period of 2025, primarily due to a decrease in test volume of higher-margin projects.
Non-GAAP gross profit, which excludes depreciation and amortization expenses, was RMB100.1 million (US$14.8 million) for the three months ended June 30, 2026, representing a 9.4% decrease from RMB110.5 million for the same period in 2025. Non-GAAP gross margin was 74.3% for the three months ended June 30, 2026, compared to 74.4% for the same period in 2025. For more details on these non-GAAP financial measures, please see the table captioned “Reconciliations of GAAP and Non-GAAP Results” set forth at the end of this press release.
Operating expenses were RMB115.8 million (US$17.1 million) for the three months ended June 30, 2026, representing a 3.2% decrease from RMB119.6 million for the same period in 2025. The decrease was primarily driven by business cost control to improve operating efficiency.
- Research and development expenses were RMB31.2 million (US$4.6 million) for the three months ended June 30, 2026, representing a 37.3% decrease from RMB49.8 million for the same period in 2025, primarily due to a temporary decrease across different research phases.
- Selling and marketing expenses were RMB47.1 million (US$6.9 million) for the three months ended June 30, 2026, representing a 22.7% increase from RMB38.4 million for the same period in 2025, primarily due to an increase in staff costs.
-
General and administrative expenses were RMB37.5 million (US$5.6 million) for the three months ended June 30, 2026, representing a 19.2% increase from RMB31.4 million for the same period in 2025, primarily due to an increase in allowance for credit loss in relation to accounts receivables, partially offset by a decrease in share-based compensation expenses.
Net loss was RMB18.4 million (US$2.7 million) for the three months ended June 30, 2026, compared to RMB9.7 million for the same period in 2025.
Cash, cash equivalents and restricted cash were RMB419.1 million (US$61.8 million) as of June 30, 2026.
Exchange Rate Information
This press release contains translations of certain Renminbi amounts into U.S. dollars at a specified rate solely for the convenience of the reader. Unless otherwise noted, all translations from Renminbi to U.S. dollars and from U.S. dollars to Renminbi are made at a rate of RMB6.7851 to US$1.00, the exchange rate on June 30 2026, set forth in the H.10 statistical release of the Federal Reserve Board. The Company makes no representation that the Renminbi or U.S. dollars amounts referred could be converted into U.S. dollars or Renminbi, as the case may be, at any particular rate or at all.
About Burning Rock
Burning Rock Biotech Limited (NASDAQ: BNR), whose mission is to guard life via science, focuses on the application of next generation sequencing (NGS) technology in the field of precision oncology. Its business consists of i) NGS-based therapy selection testing for late-stage cancer patients, and ii) cancer early detection, which has moved beyond proof-of-concept R&D into the clinical validation stage.
For more information about Burning Rock, please visit: ir.brbiotech.com .
Safe Harbor Statement
This press release contains forward-looking statements. These statements constitute “forward-looking” statements within the meaning of Section 21E of the Securities Exchange Act of 1934, as amended, and as defined in the U.S. Private Securities Litigation Reform Act of 1995. These forward-looking statements can be identified by terminology such as “will,” “expects,” “anticipates,” “future,” “intends,” “plans,” “believes,” “estimates,” “target,” “confident” and similar statements. Burning Rock may also make written or oral forward-looking statements in its periodic reports to the SEC, in its annual report to shareholders, in press releases and other written materials and in oral statements made by its officers, directors or employees to third parties. Statements that are not historical facts, including statements about Burning Rock’s beliefs and expectations, are forward-looking statements. Such statements are based upon management’s current expectations and current market and operating conditions, and relate to events that involve known or unknown risks, uncertainties and other factors, all of which are difficult to predict and many of which are beyond Burning Rock’s control. Forward-looking statements involve risks, uncertainties and other factors that could cause actual results to differ materially from those contained in any such statements. All information provided in this press release is as of the date of this press release, and Burning Rock does not undertake any obligation to update any forward-looking statement as a result of new information, future events or otherwise, except as required under applicable law.
Non-GAAP Measures
In evaluating the business, the Company considers and uses non-GAAP measures, such as non-GAAP gross profit and non-GAAP gross margin, as supplemental measures to review and assess operating performance and formulate business plans. However, the presentation of these non-GAAP financial measures is not intended to be considered in isolation or as a substitute for the financial information prepared and presented in accordance with accounting principles generally accepted in the United States of America (“U.S. GAAP”). These non-GAAP financial measures may be different from non-GAAP methods of accounting and reporting used by other companies, including peer companies, and therefore their comparability may be limited.
The Company defines non-GAAP gross profit as gross profit excluding depreciation and amortization. The Company defines non-GAAP gross margin as non-GAAP gross profit divided by its revenue.
The Company believes presenting non-GAAP gross profit and non-GAAP gross margin excluding non-cash impact of depreciation and amortization, in addition to the Company’s GAAP gross profit and gross margin, provides a better understanding of the underlying trends in the Company’s operating business performance.
Reconciliation of these non-GAAP financial measures to the most directly comparable U.S. GAAP measures are set forth at the end of this press release, all of which should be considered when evaluating the Company’s performance.
Contact: [email protected]
|
Selected Operating Data
|
|||||
|
As of
|
|||||
| June 30, | September 30, | December 31, | March 31, | June 30, | |
| 2025 | 2025 | 2025 | 2026 | 2026 | |
| In-hospital channel: | |||||
| Pipeline partner hospitals(1) | 30 | 31 | 30 | 30 | 30 |
| Contracted partner hospitals(2) | 63 | 63 | 64 | 64 | 64 |
| Total number of partner hospitals | 93 | 94 | 94 | 94 | 94 |
| (1) | Refers to hospitals that are in the process of establishing in-hospital laboratories, laboratory equipment procurement or installation, staff training or pilot testing using the Company’s products. |
| (2) | Refers to hospitals that have entered into contracts to purchase the Company’s products for use on a recurring basis in their respective in-hospital laboratories the Company helped them establish. Kit revenue is generated from contracted hospitals. |
|
Selected Financial Data
|
|||||
|
For the three months ended
|
|||||
| June 30, | September 30, | December 31, | March 31, | June 30, | |
| Revenues | 2025 | 2025 | 2025 | 2026 | 2026 |
| (RMB in thousands) | |||||
| Central laboratory channel | 40,861 | 36,811 | 44,025 | 32,420 | 36,782 |
| In-hospital channel | 62,496 | 52,847 | 51,005 | 52,761 | 67,145 |
| Pharma research and development channel | 45,197 | 41,959 | 31,285 | 22,762 | 30,838 |
| Total revenues | 148,554 | 131,617 | 126,315 | 107,943 | 134,765 |
|
For the three months ended
|
|||||
| June 30, | September 30, | December 31, | March 31, | June 30, | |
| Revenues by location of contracting customer | 2025 | 2025 | 2025 | 2026 | 2026 |
| (RMB in thousands) | |||||
| Overseas | 37,458 | 17,214 | 21,849 | 8,544 | 17,878 |
| Chinese mainland | 111,096 | 114,403 | 104,466 | 99,399 | 116,887 |
| Total revenues | 148,554 | 131,617 | 126,315 | 107,943 | 134,765 |
|
For the three months ended
|
|||||
| June 30, | September 30, | December 31, | March 31, | June 30, | |
| Gross profit | 2025 | 2025 | 2025 | 2026 | 2026 |
| (RMB in thousands) | |||||
| Central laboratory channel | 35,937 | 30,126 | 39,322 | 28,761 | 31,510 |
| In-hospital channel | 46,490 | 37,925 | 38,388 | 38,458 | 51,760 |
| Pharma research and development channel | 25,676 | 30,793 | 20,856 | 10,789 | 14,543 |
| Total gross profit | 108,103 | 98,844 | 98,566 | 78,008 | 97,813 |
| For the three months ended | |||||||
| June 30, | September 30, | December 31, | March 31, | June 30, | |||
| Share-based compensation expenses | 2025 | 2025 | 2025 | 2026 | 2026 | ||
| (RMB in thousands) | |||||||
| Cost of revenues | 280 | 301 | 300 | 82 | 141 | ||
| Research and development expenses | (270 | ) | 73 | 259 | (345 | ) | 345 |
| Selling and marketing expenses | 364 | 624 | 748 | 164 | 269 | ||
| General and administrative expenses | 2,005 | 2,831 | 1,815 | 1,907 | 1,244 | ||
| Total share-based compensation expenses | 2,379 | 3,829 | 3,122 | 1,808 | 1,999 | ||
|
Burning
Rock
Biotech
Limited
|
|||||||||||||||||
|
Unaudited
Condensed
Statements
of
Comprehensive
Loss
|
|||||||||||||||||
|
(in
thousands,
except
for
number
of
shares
and
per
share
data)
|
|||||||||||||||||
| For the three months ended | |||||||||||||||||
| June 30, | September 30, | December 31, | March 31, | June 30, | June 30, | ||||||||||||
|
2025
|
2025
|
2025
|
2026
|
2026
|
2026
|
||||||||||||
| RMB | RMB | RMB | RMB | RMB | US$ | ||||||||||||
| Revenues | 148,554 | 131,617 | 126,315 | 107,943 | 134,765 | 19,862 | |||||||||||
| Cost of revenues | (40,451 | ) | (32,773 | ) | (27,749 | ) | (29,935 | ) | (36,952 | ) | (5,446 | ) | |||||
| Gross profit | 108,103 | 98,844 | 98,566 | 78,008 | 97,813 | 14,416 | |||||||||||
| Operating expenses: | |||||||||||||||||
| Research and development expenses | (49,770 | ) | (41,469 | ) | (34,866 | ) | (27,559 | ) | (31,230 | ) | (4,603 | ) | |||||
| Selling and marketing expenses | (38,413 | ) | (41,808 | ) | (44,066 | ) | (41,206 | ) | (47,141 | ) | (6,948 | ) | |||||
| General and administrative expenses | (31,417 | ) | (31,698 | ) | (31,672 | ) | (28,088 | ) | (37,443 | ) | (5,518 | ) | |||||
| Total operating expenses | (119,600 | ) | (114,975 | ) | (110,604 | ) | (96,853 | ) | (115,814 | ) | (17,069 | ) | |||||
| Loss from operations | (11,497 | ) | (16,131 | ) | (12,038 | ) | (18,845 | ) | (18,001 | ) | (2,653 | ) | |||||
| Interest income | 2,226 | 1,744 | 1,502 | 1,261 | 1,370 | 202 | |||||||||||
| Interest expense | - | (15 | ) | (15 | ) | (15 | ) | (15 | ) | (2 | ) | ||||||
| Other income (expense), net | 387 | 7 | 1 | 294 | (199 | ) | (29 | ) | |||||||||
| Foreign exchange (loss) gain, net | (574 | ) | (2,151 | ) | (3,960 | ) | 65 | (1,278 | ) | (188 | ) | ||||||
| Loss before income tax | (9,458 | ) | (16,546 | ) | (14,510 | ) | (17,240 | ) | (18,123 | ) | (2,670 | ) | |||||
| Income tax expenses | (244 | ) | (212 | ) | (876 | ) | (232 | ) | (287 | ) | (42 | ) | |||||
| Net loss | (9,702 | ) | (16,758 | ) | (15,386 | ) | (17,472 | ) | (18,410 | ) | (2,712 | ) | |||||
| Net loss attributable to Burning Rock Biotech Limited’s shareholders | (9,702 | ) | (16,758 | ) | (15,386 | ) | (17,472 | ) | (18,410 | ) | (2,712 | ) | |||||
| Net loss attributable to ordinary shareholders | (9,702 | ) | (16,758 | ) | (15,386 | ) | (17,472 | ) | (18,410 | ) | (2,712 | ) | |||||
| Loss per share for class A and class B ordinary shares: | |||||||||||||||||
| Class A ordinary shares - basic and diluted | (0.09 | ) | (0.16 | ) | (0.15 | ) | (0.17 | ) | (0.17 | ) | (0.02 | ) | |||||
| Class B ordinary shares - basic and diluted | (0.09 | ) | (0.16 | ) | (0.15 | ) | (0.17 | ) | (0.17 | ) | (0.02 | ) | |||||
| Weighted average shares outstanding used in loss per share computation: | |||||||||||||||||
| Class A ordinary shares - basic and diluted | 90,357,970 | 90,416,619 | 87,444,109 | 87,871,026 | 91,279,393 | 91,279,393 | |||||||||||
| Class B ordinary shares - basic and diluted | 17,324,848 | 17,324,848 | 17,324,848 | 17,324,848 | 17,324,848 | 17,324,848 | |||||||||||
| Other comprehensive loss, net of tax of nil: | |||||||||||||||||
| Foreign currency translation adjustments | (243 | ) | (1,724 | ) | (2,050 | ) | (3,143 | ) | (2,971 | ) | (438 | ) | |||||
| Total comprehensive loss | (9,945 | ) | (18,482 | ) | (17,436 | ) | (20,615 | ) | (21,381 | ) | (3,150 | ) | |||||
| Total comprehensive loss attributable to Burning Rock Biotech Limited’s shareholders | (9,945 | ) | (18,482 | ) | (17,436 | ) | (20,615 | ) | (21,381 | ) | (3,150 | ) | |||||
|
Burning Rock Biotech Limited
|
|||||
|
Unaudited Condensed Consolidated Balance Sheets
|
|||||
|
(In
thousands)
|
|||||
| As of | |||||
| December 31, | June 30, | June 30, | |||
| 2025 | 2026 | 2026 | |||
| RMB | RMB | US$ | |||
| ASSETS | |||||
| Current assets: | |||||
| Cash and cash equivalents | 478,392 | 416,818 | 61,431 | ||
| Restricted cash | 2,696 | 2,290 | 338 | ||
| Accounts receivable, net | 169,611 | 172,768 | 25,463 | ||
| Contract assets, net | 12,301 | 9,777 | 1,441 | ||
| Inventories, net | 48,576 | 34,131 | 5,030 | ||
| Contract costs | 8,399 | 5,597 | 825 | ||
| Prepayments and other current assets | 18,611 | 22,636 | 3,337 | ||
| Total current assets | 738,586 | 664,017 | 97,865 | ||
| Non-current assets: | |||||
| Property and equipment, net | 31,099 | 31,808 | 4,688 | ||
| Operating right-of-use assets | 42,774 | 46,282 | 6,821 | ||
| Intangible assets, net | 284 | 233 | 35 | ||
| Other non-current assets | 7,632 | 8,271 | 1,219 | ||
| Total non-current assets | 81,789 | 86,594 | 12,763 | ||
| TOTAL ASSETS | 820,375 | 750,611 | 110,628 | ||
|
Burning
Rock
Biotech
Limited
|
||||||||
|
Unaudited Condensed
Consolidated
Balance
Sheets
(Continued)
|
||||||||
|
(in
thousands)
|
||||||||
| As of | ||||||||
| December 31, | June 30, | June 30, | ||||||
|
2025
|
2026
|
2026
|
||||||
| RMB | RMB | US$ | ||||||
| LIABILITIES AND SHAREHOLDERS’ EQUITY | ||||||||
| Current liabilities: | ||||||||
| Accounts payable | 40,744 | 17,950 | 2,646 | |||||
| Deferred revenue | 107,819 | 109,170 | 16,090 | |||||
| Accrued liabilities and other current liabilities | 80,861 | 68,458 | 10,090 | |||||
| Customer deposits | 592 | 592 | 87 | |||||
| Current portion of long-term borrowings | 200 | 200 | 29 | |||||
| Current portion of operating lease liabilities | 16,762 | 21,172 | 3,120 | |||||
| Total current liabilities | 246,978 | 217,542 | 32,062 | |||||
| Non-current liabilities: | ||||||||
| Long-term borrowings | 1,700 | 1,600 | 236 | |||||
| Non-current portion of operating lease liabilities | 24,458 | 22,140 | 3,263 | |||||
| Other non-current liabilities | 11,975 | 12,248 | 1,805 | |||||
| Total non-current liabilities | 38,133 | 35,988 | 5,304 | |||||
| TOTAL LIABILITIES | 285,111 | 253,530 | 37,366 | |||||
| Shareholders’ equity: | ||||||||
| Class A ordinary shares | 120 | 126 | 19 | |||||
| Class B ordinary shares | 21 | 21 | 3 | |||||
| Additional paid-in capital | 5,010,060 | 5,013,867 | 738,953 | |||||
| Treasury stock | (57,193 | ) | (57,193 | ) | (8,429 | ) | ||
| Accumulated deficits | (4,255,607 | ) | (4,291,489 | ) | (632,487 | ) | ||
| Accumulated other comprehensive loss | (162,137 | ) | (168,251 | ) | (24,797 | ) | ||
| Total shareholders’ equity | 535,264 | 497,081 | 73,262 | |||||
| TOTAL LIABILITIES AND SHAREHOLDERS’ EQUITY | 820,375 | 750,611 | 110,628 | |||||
|
Burning Rock Biotech Limited
|
||||||||
|
Unaudited Condensed Statements of Cash Flows
|
||||||||
|
(in
thousands)
|
||||||||
| For the six months ended | ||||||||
| June 30, | June 30, | June 30, | ||||||
|
2025
|
2026
|
2026
|
||||||
| RMB | RMB | US$ | ||||||
| Net cash used in operating activities | (67,876 | ) | (51,657 | ) | (7,613 | ) | ||
| Net cash used in investing activities | (1,324 | ) | (2,841 | ) | (419 | ) | ||
| Net cash generated from/(used in) financing activities | 2,000 | (100 | ) | (15 | ) | |||
| Effect of exchange rate on cash, cash equivalents and restricted cash | 62 | (7,382 | ) | (1,088 | ) | |||
| Net decrease in cash, cash equivalents and restricted cash | (67,138 | ) | (61,980 | ) | (9,135 | ) | ||
| Cash, cash equivalents and restricted cash at the beginning of period | 522,162 | 481,088 | 70,904 | |||||
| Cash, cash equivalents and restricted cash at the end of period | 455,024 | 419,108 | 61,769 | |||||
|
Burning Rock Biotech Limited
|
||||||||||
|
Reconciliations of GAAP and Non-GAAP Results
|
||||||||||
| For the three months ended | ||||||||||
| June 30, | September 30, | December 31, | March 31, | June 30, | ||||||
|
2025
|
2025
|
2025
|
2026
|
2026
|
||||||
| (RMB in thousands) | ||||||||||
| Gross profit: | ||||||||||
| Central laboratory channel | 35,937 | 30,126 | 39,322 | 28,761 | 31,510 | |||||
| In-hospital channel | 46,490 | 37,925 | 38,388 | 38,458 | 51,760 | |||||
| Pharma research and development channel | 25,676 | 30,793 | 20,856 | 10,789 | 14,543 | |||||
| Total gross profit | 108,103 | 98,844 | 98,566 | 78,008 | 97,813 | |||||
| Add: depreciation and amortization: | ||||||||||
| Central laboratory channel | 456 | 231 | 490 | 412 | 548 | |||||
| In-hospital channel | 389 | 372 | 308 | 228 | 297 | |||||
| Pharma research and development channel | 1,528 | 1,491 | 2,057 | 1,885 | 1,425 | |||||
| Total depreciation and amortization included in cost of revenues | 2,373 | 2,094 | 2,855 | 2,525 | 2,270 | |||||
| Non-GAAP gross profit: | ||||||||||
| Central laboratory channel | 36,393 | 30,357 | 39,812 | 29,173 | 32,058 | |||||
| In-hospital channel | 46,879 | 38,297 | 38,696 | 38,686 | 52,057 | |||||
| Pharma research and development channel | 27,204 | 32,284 | 22,913 | 12,674 | 15,968 | |||||
| Total non-GAAP gross profit | 110,476 | 100,938 | 101,421 | 80,533 | 100,083 | |||||
| Non-GAAP gross margin: | ||||||||||
| Central laboratory channel | 89.1 | % | 82.5 | % | 90.4 | % | 90.0 | % | 87.2 | % |
| In-hospital channel | 75.0 | % | 72.5 | % | 75.9 | % | 73.3 | % | 77.5 | % |
| Pharma research and development channel | 60.2 | % | 76.9 | % | 73.2 | % | 55.7 | % | 51.8 | % |
| Total non-GAAP gross margin | 74.4 | % | 76.7 | % | 80.3 | % | 74.6 | % | 74.3 | % |