


VCI Global Limited reports a net loss of $30.2 million after spinning off VCCG and restructuring for growth.
Quiver AI Summary
VCI Global Limited reported its financial results for the fiscal year ending December 31, 2025, marking a transformative period for the company characterized by a major corporate restructuring and the spin-off of its consulting arm, V Capital Consulting Group Limited (VCCG). The restructuring was part of a strategic shift towards becoming an AI-native operating platform with a focus on AI infrastructure, digital assets, and renewable energy. The company reported a revenue of $26.1 million, a decrease from $27.8 million in the previous year, with a notable increase in revenue from technology development (up 13.3% to $12.9 million). Despite this growth, VCI Global experienced a net loss of $30.2 million due to restructuring costs and non-cash valuation adjustments. The management emphasized that investments in AI infrastructure and technology positioning will prepare the company for future growth, even though current financial results reflected significant accounting charges and earnings pressure. Moving into fiscal year 2026, VCI Global aims to capitalize on new opportunities while aiming for long-term value creation.
Potential Positives
- Successfully completed the spin-off of V Capital Consulting Group Limited (VCCG), allowing for a sharper focus on core areas such as AI infrastructure, enterprise technology, digital assets, and renewable energy.
- Achieved a 13.3% year-over-year increase in revenue from technology development, solutions, and consultancy, highlighting strong performance in technology-driven segments.
- Reported a significant surge in other income to US$9.4 million, largely attributed to a US$5.9 million foreign exchange gain and US$2.5 million in non-recurring settlement compensation, indicating improved financial diversity and resilience.
- Entered fiscal year 2026 with a streamlined corporate structure designed to accelerate commercialization and support future growth opportunities in emerging technologies.
Potential Negatives
- Revenue decreased by 6% from the previous year, raising concerns about the company's growth trajectory.
- Reported a significant net loss of US$30.2 million, indicating financial struggles and potential sustainability issues.
- Operating cash generated dropped dramatically to US$2.6 million from US$22.3 million in the prior year, suggesting deteriorating cash flow management.
FAQ
What was VCI Global's revenue for the fiscal year ended December 31, 2025?
VCI Global reported revenue of US$26.1 million for the fiscal year 2025, down from US$27.8 million in 2024.
How did the spin-off of VCCG impact VCI Global?
The spin-off of V Capital Consulting Group Limited allowed VCI Global to focus more on AI infrastructure and digital assets.
What were the main factors contributing to VCI Global's net loss?
VCI Global's net loss of US$30.2 million was primarily due to restructuring expenses, non-cash valuation adjustments, and losses on disposals.
What growth did VCI Global see in technology-related revenue?
Revenue from technology development, solutions, and consultancy increased by 13.3% year-over-year to US$12.9 million in fiscal 2025.
How much did VCI Global invest in AI infrastructure and technology?
VCI Global significantly increased IT expenses to US$5.7 million, mainly for AI infrastructure and technology investments in fiscal 2025.
Disclaimer: This is an AI-generated summary of a press release distributed by GlobeNewswire. The model used to summarize this release may make mistakes. See the full release here.
$VCIG Insider Trading Activity
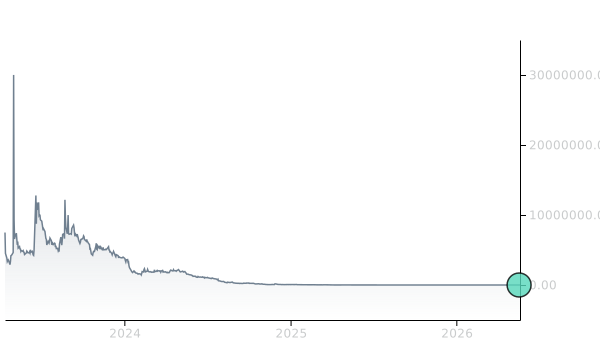
$VCIG insiders have traded $VCIG stock on the open market 2 times in the past 6 months. Of those trades, 2 have been purchases and 0 have been sales.
Here’s a breakdown of recent trading of $VCIG stock by insiders over the last 6 months:
- VOON HIM HOO (CEO and Director) has made 2 purchases buying 1,854,135 shares for an estimated $1,769,999 and 0 sales.
To track insider transactions, check out Quiver Quantitative's insider trading dashboard. You can access data on insider stock transactions through the Quiver Quantitative API insider transaction endpoint.
$VCIG Hedge Fund Activity
We have seen 3 institutional investors add shares of $VCIG stock to their portfolio, and 6 decrease their positions in their most recent quarter.
Here are some of the largest recent moves:
- JANE STREET GROUP, LLC removed 47,075 shares (-100.0%) from their portfolio in Q1 2026, for an estimated $66,846
- STONEX GROUP INC. removed 19,794 shares (-100.0%) from their portfolio in Q1 2026, for an estimated $28,107
- HRT FINANCIAL LP added 16,393 shares (+inf%) to their portfolio in Q1 2026, for an estimated $23,278
- KESTRA PRIVATE WEALTH SERVICES, LLC removed 10,003 shares (-100.0%) from their portfolio in Q1 2026, for an estimated $14,204
- UBS GROUP AG removed 6,094 shares (-94.8%) from their portfolio in Q1 2026, for an estimated $8,653
- CYGNUS CAPITAL ADVISORS, LLC added 5,136 shares (+inf%) to their portfolio in Q1 2026, for an estimated $7,293
- WESTSIDE INVESTMENT MANAGEMENT, INC. removed 508 shares (-96.9%) from their portfolio in Q1 2026, for an estimated $721
To track hedge funds' stock portfolios, check out Quiver Quantitative's institutional holdings dashboard. You can access data on hedge funds moves and 13F filings through the Quiver Quantitative API 13F endpoint.
Full Release
Transformation Year Marked by the Successful Spin-off of VCCG, Strategic Investment in AI Infrastructure and Next-Generation Technologies, and the Completion of a Comprehensive Corporate Restructuring to Position the Company for its Next Phase of Growth
KUALA LUMPUR, Malaysia, July 15, 2026 (GLOBE NEWSWIRE) -- VCI Global Limited (NASDAQ: VCIG) (“VCI Global” or the “Company”), an AI-native operating platform focused on AI infrastructure, digital assets, renewable energy, and enterprise technologies, today announced its financial results for the fiscal year ended December 31, 2025 (the “Financial Results”), a transformational year during which the Company completed a comprehensive corporate restructuring, streamlined its business portfolio, and repositioned itself as an AI-native operating platform focused on scalable, technology-driven growth.
- Completed a major strategic transformation, including the spin-off of V Capital Consulting Group Limited ("VCCG"), enabling the Company to sharpen its focus on AI infrastructure, enterprise technology, digital assets, and renewable energy.
- Reported revenue of US$26.1 million in the fiscal year ended December 31, 2025, compared to US$27.8 million in the fiscal year ended December 31, 2024.
- Revenue from technology development, solutions and consultancy increased 13.3% year-over-year (YoY) to US$12.9 million, demonstrating continued momentum in the Company's technology-driven businesses.
- Other income increased to US$9.4 million, increased to US$9.3 million, primarily attributable to a US$5.9 million foreign exchange gain and US$2.5 million in non-recurring settlement compensation.
- Reported a net loss of US$30.2 million, primarily reflecting non-cash valuation adjustments, restructuring-related expenses, losses on the disposal of core subsidiaries, and strategic investments in AI infrastructure.
- Entered fiscal year 2026 with a streamlined corporate structure designed to accelerate the commercialization of the Company's AI-native operating platform.
“FY2025 was a deliberate transition year for VCI Global. We made the strategic decision to prioritize long-term value creation over short-term earnings by streamlining our portfolio, spinning off VCCG, investing aggressively in AI infrastructure, and repositioning the Group around scalable technology businesses,” said VCI Global management team.
“While these actions resulted in significant non-recurring accounting charges and near-term earnings pressure, they also established a stronger operating platform with greater strategic focus. We believe the investments and restructuring undertaken during the year have positioned VCI Global to capitalize on emerging opportunities across artificial intelligence, digital assets, renewable energy and enterprise technologies.”
FINANCIAL RESULTS
Revenue for fiscal year ended December 31, 2025 was US$26.1 million, a 6% decrease from US$27.8 million in fiscal year ended December 31, 2024.
- VCI Global’s revenue generated from the business strategy consultancy segment fee decreased by 29% to US$10.5 million for the fiscal year ended December 31, 2025, compared to US$14.8 million for the fiscal year ended December 31, 2024. The YoY decrease was primarily attributable to the timing of project execution and revenue recognition, as several large engagements reached key completion milestones in the prior year, while newly secured mandates remained in earlier phases of execution during fiscal year ended December 31, 2025. In December 2025, the Company completed the spin-off of this segment through the separation of VCCG, allowing VCI Global to sharpen its strategic focus on AI infrastructure, enterprise technology, digital assets, and renewable energy while enabling VCCG to pursue its growth strategy as a dedicated capital markets advisory business.
- The Company’s revenue generated from technology development, solutions and consultancy increased by 13.3% to US$12.9 million for fiscal year ended December 31, 2025, compared to US$11.4 million for the fiscal year ended December 31, 2024. The growth was driven by the successful commercialization and delivery of several high-value technology projects, including an AI-powered livestreaming platform, digital marketing solutions, and a gaming platform aggregation project. The segment continued to demonstrate strong execution capabilities and growing market demand for the Company's AI-driven and digital transformation solutions, reinforcing technology as a key growth engine and an increasingly important contributor to VCI Global's long-term growth strategy.
- Revenue generated from interest income increased significantly by US$1.1 million, from US$1.2 million in fiscal year ended December 31, 2024, to US$2.3 million in fiscal year ended December 31, 2025, marking an 88% growth. The growth was primarily driven by the continued expansion of the Company's fintech subsidiary, Credilab , which increased its customer loan portfolio, resulting in a larger base of income-generating loans and higher recurring interest income during the year.
- VCI Global’s revenue generated from other services increased over 2% to US$380.3 thousand for fiscal year ended December 31, 2025, compared to US$373.0 thousand for fiscal year ended December 31, 2024.
| For the Fiscal Year Ended December 31 | ||||||
| 2025 | 2024 | Change | ||||
| USD | USD | % | ||||
| Revenue from Business Strategy Consultancy | 10,486,348 | 14,824,502 | -29.3 | % | ||
|
Revenue from Technology Development, Solutions and
Consultancy |
12,935,361 | 11,412,582 | 13.3 | % | ||
| Interest Income | 2,285,415 | 1,214,842 | 88.1 | % | ||
| Others | 380,298 | 372,965 | 2.0 | % | ||
| Total Revenue | 26,087,422 | 27,824,891 | -6.2 | % | ||
Other Income for fiscal year ended December 31, 2025 was US$9.3 million, representing a surge of 3,776%, compared to US$241.6 thousand in fiscal year ended December 31, 2024. The increase was primarily driven by a foreign exchange gain of US$5.9 million, reflecting favourable currency movements during the year, and compensation of US$2.5 million received in connection with the decline in share value under a commercial settlement arrangement with a third party.
EBITDA for fiscal year ended December 31, 2025 was negative US$27.5 million.
Net loss attributable to shareholders was US$30.3 million in the fiscal year ended December 31, 2025, primarily reflecting non-cash unrealized valuation adjustments, restructuring-related expenses associated with the Company's strategic reorganization, losses on the disposal of core subsidiaries, and investments made to expand its AI infrastructure and technology capabilities.
Cost of Service was US$6.8 million for the financial year ended December 31, 2025, representing an increase of 37% from US$4.9 million for the financial year ended December 31, 2024.
- Consultant fee costs declined by 50% year-over-year to US$1.1 million , reflecting the successful completion of several major consulting engagements in fiscal year ended December 31, 2024 and the Company's transition toward technology-led businesses requiring a different operating model.
- IT expenses increased to US$5.7 million as the Company accelerated investments in AI infrastructure, generative AI capabilities, AI digital human technologies, enterprise software platforms and cloud computing resources. These investments are expected to support future product commercialization and long-term scalability.
- Subscription fee was US$8.1 thousand for the fiscal year ended December 31, 2025, compared to US$10.9 thousand for the fiscal year ended December 3, 2024.
- Other cost of service only incurred US$304 due to the disposal of the Company’s education business which resulted in the absence of training expenses and staff-related costs.
| 2025 | 2024 | Change | ||||
| USD | USD | % | ||||
| Consultant Fee | 1,087,392 | 2,194,536 | -50.5 | % | ||
| IT Expenses | 5,660,899 | 2,408,554 | 135.0 | % | ||
| Subscription Fee | 8,116 | 10,892 | -25.5 | % | ||
| Referral Fee | 0 | 181,139 | -100 | % | ||
| Others | 304 | 153,072 | -99.8 | % | ||
| Total | 6,756,711 | 4,948,193 | 36.6 | % |
Depreciation expense increased to US$536 thousand, reflecting significant capital investments made during the year, including the expansion of office and campus facilities, technology infrastructure, enterprise software and equipment required to support the Company's strategic transformation.
Employee benefit expenses increased to US$17.3 million as the Company expanded its workforce across technology, engineering, artificial intelligence and corporate functions to support the execution of its long-term growth strategy.
Other operating expenses primarily consist of marketing expenses, staff welfare, office expenses, travel expenses, secretarial fees and other miscellaneous operating expenses. Other operating expenses increased by US$22.4 million, from US$4.4 million in fiscal year ended December 31, 2024 to US$26.7 million in fiscal year ended December 31, 2025. The increase was primarily attributable to non-recurring charges associated with the Company's strategic transformation, including losses recognized on the disposal of subsidiaries as part of its portfolio optimization initiatives, higher provisions for receivables following prudent management assessments, and investment losses arising from the rationalization of certain investment holdings. In addition, the Company increased investments in customer engagement, brand building, and business development initiatives to support the commercialization of its AI-native operating platform and strengthen its long-term growth prospects.
Basic and diluted earnings per share was negative US$463.01 for the financial year ended December 31, 2025.
CASH POSITION AND CAPITAL ALLOCATION
Net cash generated operating activities was US$2.6 million in fiscal year ended December 31, 2025, from US$22.3 million in the previous fiscal year.
Net cash used in investing activities was US$73.0 million as of December 31, 2025, a significant increase from US$48.6 million as of December 21, 2024.
Net cash generated from financing activities in the fiscal year ended December 31, 2025 was US$66.2 million, primarily reflecting proceeds of convertible notes at US$14.0 million, repayment of finance lease liabilities at US$1.6 million, and proceeds from issuance of shares at US$53.7 million.
Cash and cash equivalents were recorded at US$940 thousand as of December 31, 2025, compared to the US$8.1 million as of December 31, 2024.
About VCI Global Limited
VCI Global Limited (NASDAQ: VCIG) is an AI-native operating platform designed to scale and optimize businesses through centralized intelligence, data, and capital discipline.
The Company operates a platform-based model in which subsidiaries, affiliates, and portfolio companies plug into VCI Global’s centralized AI, data, governance, and capital allocation systems, enabling faster execution, improved capital efficiency, and scalable growth across multiple industries.
VCI Global’s platform centralizes AI-enabled execution, standardized KPI frameworks, financial and governance controls, and strategic capital allocation, while operating businesses focus on revenue generation, customer relationships, and local execution.
The Company maintains exposure across advisory, AI, and digital infrastructure, digital assets, energy, automotive, and consumer sectors, and continuously evaluates opportunities to scale, spin off, divest, or discontinue businesses based on performance, scalability, and return on capital.
VCI Global’s platform-centric approach is designed to enhance productivity, improve IPO readiness, and unlock long-term value through disciplined growth and selective capital deployment.
For more information on the Company, please log on to https://v-capital.co/ .
Cautionary Note Regarding Forward-Looking Statements
This press release contains forward-looking statements that are subject to various risks and uncertainties. Such statements include statements regarding the Company’s ability to grow its business and other statements that are not historical facts, including statements which may be accompanied by the words “intends,” “may,” “will,” “plans,” “expects,” “anticipates,” “projects,” “predicts,” “estimates,” “aims,” “believes,” “hopes,” “potential” or similar words. These forward-looking statements are based only on our current beliefs, expectations, and other future conditions. Because forward-looking statements relate to the future, they are subject to inherent uncertainties, risks, and changes in circumstances that are difficult to predict and many of which are outside of our control. Therefore, you should not rely on any of these forward-looking statements. Actual results could differ materially from those described in these forward-looking statements due to certain factors, including without limitation, the Company’s ability to achieve profitable operations, customer acceptance of new products, the effects of the spread of coronavirus (COVID-19) and future measures taken by authorities in the countries wherein the Company has supply chain partners, the demand for the Company’s products and the Company’s customers’ economic condition, the impact of competitive products and pricing, successfully managing and, general economic conditions and other risk factors detailed in the Company’s filings with the United States Securities and Exchange Commission (“SEC”). The forward-looking statements contained in this press release are made as of the date of this press release, and the Company does not undertake any responsibility to update the forward-looking statements in this release, except in accordance with applicable law.
CONTACT INFORMATION:
For media queries, please contact:
VCI GLOBAL LIMITED
[email protected]
Financial Tables
|
VCI Global Limited and Its Subsidiaries
Consolidated Statements of Financial Position As of December 31, 2024 and 2025 |
|||
|
December 31,
2025 |
December 31,
202 |
||
| USD | USD | ||
| ASSETS | |||
| Non-current assets | |||
| Financial assets at fair value through other comprehensive income | 17,513,555 | 28,547,482 | |
| Investment in associates | 2 | - | |
| Property and equipment | 1,061,170 | 573,084 | |
| Right-of-use assets | 734,696 | 120,670 | |
| Intangible assets | 4,050,583 | 7,288,633 | |
| Amount due from related parties | 62,833,133 | - | |
| Loan receivables | - | 6,562,292 | |
| Total non-current assets | 86,193,139 | 43,092,161 | |
| Current assets | |||
| Trade and other receivables | 29,512,675 | 30,009,175 | |
| Inventories | 257,485 | - | |
| Loan receivables | - | 10,283,529 | |
| Tax recoverable | - | 73,976 | |
| Cash and bank balances | 940,963 | 8,100,899 | |
| Total current assets | 30,711,123 | 48,467,579 | |
| Total assets | 116,904,262 | 91,559,740 | |
| LIABILITIES AND EQUITY | |||
| Current liabilities | |||
| Trade and other payables | 13,237,049 | 4,415,133 | |
| Lease liabilities | 399,858 | 82,431 | |
| Bank and other borrowings | - | 160,455 | |
| Warrant liabilities | 2,625,440 | 33,305 | |
| Convertible note liabilities | 2,930,281 | - | |
| Amount due to related parties | - | 487,111 | |
| Income tax payable | 692,322 | - | |
| Total current liabilities | 19,884,950 | 5,178,435 | |
| Non-current liabilities | |||
| Lease liabilities | 346,754 | 37,553 | |
| Bank and borrowings | - | 21,936 | |
| Amount due to related parties | 456,084 | - | |
| Deferred tax liabilities | 5,382 | - | |
| Total non-current liabilities | 808.220 | 59,489 | |
| Total liabilities | 20,639,170 | 5,237,924 | |
|
VCI Global Limited and Its Subsidiaries
Consolidated Statements of Financial Position As of December 31, 2024 and 2025 |
|||||
|
December 31,
2025 |
December 31,
2024 |
||||
| USD | USD | ||||
| Capital and reserves | |||||
| Share capital | 150,490,803 | 76,395,175 | |||
| Capital reserve | 1,609,623 | 1,461,292 | |||
| Fair value reserve | (32,709,812 | ) | (480,596 | ) | |
| Translation reserves | (2,873,505 | ) | (981,534 | ) | |
| (Accumulated losses)/Retained earnings | (20,304,578 | ) | 9,928,734 | ||
| Attributable to equity owners of the Company | 96,212,531 | 86,323,071 | |||
| Non-controlling interests | (1,439 | ) | (1,255 | ) | |
| Total equity | 96,211,092 | 86,321,816 | |||
| Total liabilities and equity | 116,904,262 | 91,559,740 | |||
|
VCI Global Limited and Its Subsidiaries
Consolidated Statements of Profit or Loss and Other Comprehensive Income/(Loss) For The Years Ended December 31, 2024 and 2025 |
|||||
|
December 31,
2025 |
December 31,
2024 |
||||
| USD | USD | ||||
| Revenue | 26,087,422 | 27,824,891 | |||
| Revenue - related party | - | - | |||
| Total revenue | 26,087,422 | 27,824,891 | |||
| Other income | 9,364,628 | 241,591 | |||
| Cost of services | (6,756,711 | ) | (4,948,193 | ) | |
| Depreciation | (536,519 | ) | (238,058 | ) | |
| Amortisation of Intangible Assets | (955,970 | ) | (207,989 | ) | |
| Employee benefit expense | (17,345,345 | ) | (6,811,397 | ) | |
| Provision for allowance for expected credit losses on loan receivables | (8,424,085 | ) | (919,271 | ) | |
| Provision for allowance for expected credit losses on trade and other receivables | (31,867 | ) | (53,252 | ) | |
| Rental expenses | (112,726 | ) | (100,530 | ) | |
| Legal and professional fees | (3,546,333 | ) | (2,608,458 | ) | |
| Finance cost | (619,994 | ) | (131,912 | ) | |
| Other operating expenses | (26,744,020 | ) | (4,362,179 | ) | |
| Profit before income tax | (29,621,520 | ) | 7,685,243 | ||
| Income tax expense | (638,107 | ) | (108,416 | ) | |
| Profit for the year | (30,259,627 | ) | 7,576,827 | ||
|
Other comprehensive income/(loss):
Items that will not be reclassified subsequently to profit or loss: |
|||||
| Fair value adjustment on financial assets, at fair value through other comprehensive income | (32,476,445 | ) | (10,196,302 | ) | |
| Items that may be reclassified subsequently to profit or loss: | |||||
| Exchange differences on translating foreign operation | (2,873,505 | ) | (1,584,687 | ) | |
| Other comprehensive income/(loss) | (35,349,950 | ) | (11,780,989 | ) | |
| Total comprehensive income/(loss) for the year | (65,609,577 | ) | (4,204,162 | ) | |
|
VCI Global Limited and Its Subsidiaries
Consolidated Statements of Profit or Loss and Other Comprehensive Income/(Loss) For The Years Ended December 31, 2024 and 2025 |
|||||
|
December 31,
2025 |
December 31,
2024 |
||||
| USD | USD | ||||
| Profit attributable to: | |||||
| Equity owners of the Company | (30,259,560 | ) | 7,874,203 | ||
| Non-controlling interests | (67 | ) | (297,376 | ) | |
| Total | (30,259,627 | ) | 7,576,827 | ||
| Total comprehensive income/(loss) attributable to: | |||||
| Equity owners of the Company | (65,609,510 | ) | (3,906,786 | ) | |
| Non-controlling interests | (67 | ) | (297,376 | ) | |
| Total | (65,609,577 | ) | (4,204,162 | ) | |
|
VCI Global Limited and Its Subsidiaries
Consolidated Statements of Cash Flows For The Years Ended December 31, 2024 and 2025 |
|||
|
December 31,
2025 |
December 31,
2024 |
||
| USD | USD | ||
| Operating activities | |||
| Profit/loss before income tax | -29,621,520 | 7,685,243 | |
| Adjustment for: | |||
| Impairment loss on intangible assets | 918,324 | ||
| Provision for allowance for expected credit losses on trade and other receivables | 5,155,117 | 549,924 | |
| Provision for allowance for expected credit losses on other receivables | 3,268,968 | 369,347 | |
| Provision for allowance for expected credit losses on loan receivables | 31,867 | 53,252 | |
| Non-cash revenue | -4,476,756 | - | |
| Acquisition of financial assets in shares | -31,974,000 | - | |
| Reversal on impairment allowance of trade receivable | -60,808 | - | |
| Reversal on impairment allowance of other receivables | -265,920 | - | |
| Reversal on impairment allowance of loan receivables | -5,780 | - | |
| Loss on investment | 868,346 | - | |
| Fair value loss on financial assets, at fair value through profit or loss | - | 14,407 | |
| Share-based compensation awards | 6,651,698 | 1,890,495 | |
| Share option expenses | 308,878 | - | |
| Director fee paid in shares | 4,487,613 | - | |
| Share-based payment - consultancy fees | 4,511,659 | 2,900,939 | |
| Fair value loss on derivative liabilities through profit and loss | 1,067,076 | - | |
| Write-off on intangible assets | 45,765 | 4,251 | |
| Depreciation of property and equipment | 130,652 | 89,414 | |
| Depreciation of right-of-use assets | 405,866 | 148,644 | |
| Amortisation of intangible assets | 955,970 | 207,989 | |
| Change in working capital, net of effects from acquisition and disposal of subsidiaries | 42,108,520 | 399,540 | |
| Bad debt written off | 4,271,583 | - | |
| Conversion of convertible notes | - | - | |
| Issuance of warrant liabilities | 503,709 | - | |
| Loss on dissolve of subsidiaries | - | 1,033 | |
| Change in fair value of warrant liabilities | - | 33,977 | |
| Interest expenses | 619,994 | 131,912 | |
| Interest income | -4,908 | -4,140 | |
| Operating cash flows before movements in working capital | 9,901,913 | 14,476,227 | |
| Trade and other receivables | -15,982,127 | 11,989,387 | |
| Inventories | -257,485 | - | |
| Loan receivables | - | -8,717,135 | |
| Trade and other payables | 8,821,916 | 4,693,637 | |
|
Cash generated from/(used in)
operations |
2,484,217 | 22,442,116 | |
| Income tax (paid)/refund | 133,573 | -162,609 | |
| Net cash from/(used in) operating activities | 2,617,790 | 22,279,507 | |
| Investing activities | |||
| Acquisition of property and equipment | -953,191 | -327,077 | |
| Acquisition of intangible assets | -5,920,209 | -2,290,423 | |
| Interest received | 4,908 | 4,140 | |
| Acquisition of financial assets, at fair value through other comprehensive income | -7,515,616 | -47,710,805 | |
| Proceeds from disposal of financial assets measured at fair value through other comprehensive income | 4,248,592 | 1,678,000 | |
| Proceeds from disposal of financial assets, net cash and cash equivalents disposed of | -62,833,133 | - | |
| Proceed from disposal of financial assets, at fair value through profit and loss | - | 1,785 | |
|
Net cash (used in)/from
investing activities |
-72,968,649 | -48,644,380 | |
| Financing activities | |||
| Proceed from issuance of ordinary shares | 53,681,106 | 35,013,797 | |
| Proceeds from lease liabilities | 1,159,035 | - | |
| Repayment of other borrowings | - | - | |
| Repayment from bank borrowings | -9,673 | -23,989 | |
| Interest paid - Lease obligation | - | -9,491 | |
| Interest paid - convertible notes | - | - | |
| Interest paid | -619,994 | - | |
| Proceeds from initial public offering, net of transaction cost | - | - | |
| Payment for initial public offering expense | - | - | |
| Payment for lease liabilities | -1,585,022 | -160,827 | |
| Repayment of advances made from related parties | -439,048 | -290,882 | |
| Proceeds from issuance of convertible notes | 14,000,000 | - | |
| Dividend paid | - | ||
| Net cash (used in)/from financing activities | 66,186,404 | 34,528,608 | |
| Net increase/decrease in cash and cash equivalents | -4,164,455 | 8,163,735 | |
| Foreign exchange effect | -2,995,481 | -1,073,291 | |
| Cash and bank balances at beginning of year | 8,100,899 | 1,010,455 | |
| Cash and bank balances at end of year | 940,963 | 8,100,899 | |