Congress Trading Dashboard
The Stock Trading on Congressional Knowledge Act requires U.S. Senators and U.S. Representatives to publicly file and disclose any financial transaction within 45 days of its occurrence. We download those disclosures, parse them for stock trades, fetch the stock's performance in the time following the transaction, and calculate each politician's cumulative return from their trades.
MorePolitician Search
View Congress trading activity by:
Stock Search
View trading activity in Congress involving:
Track the returns and profits of stock portfolios held by U.S. politicians in Congress on our Politician Stock Portfolio Leaderboard. Available to Quiver Premium subscribers.
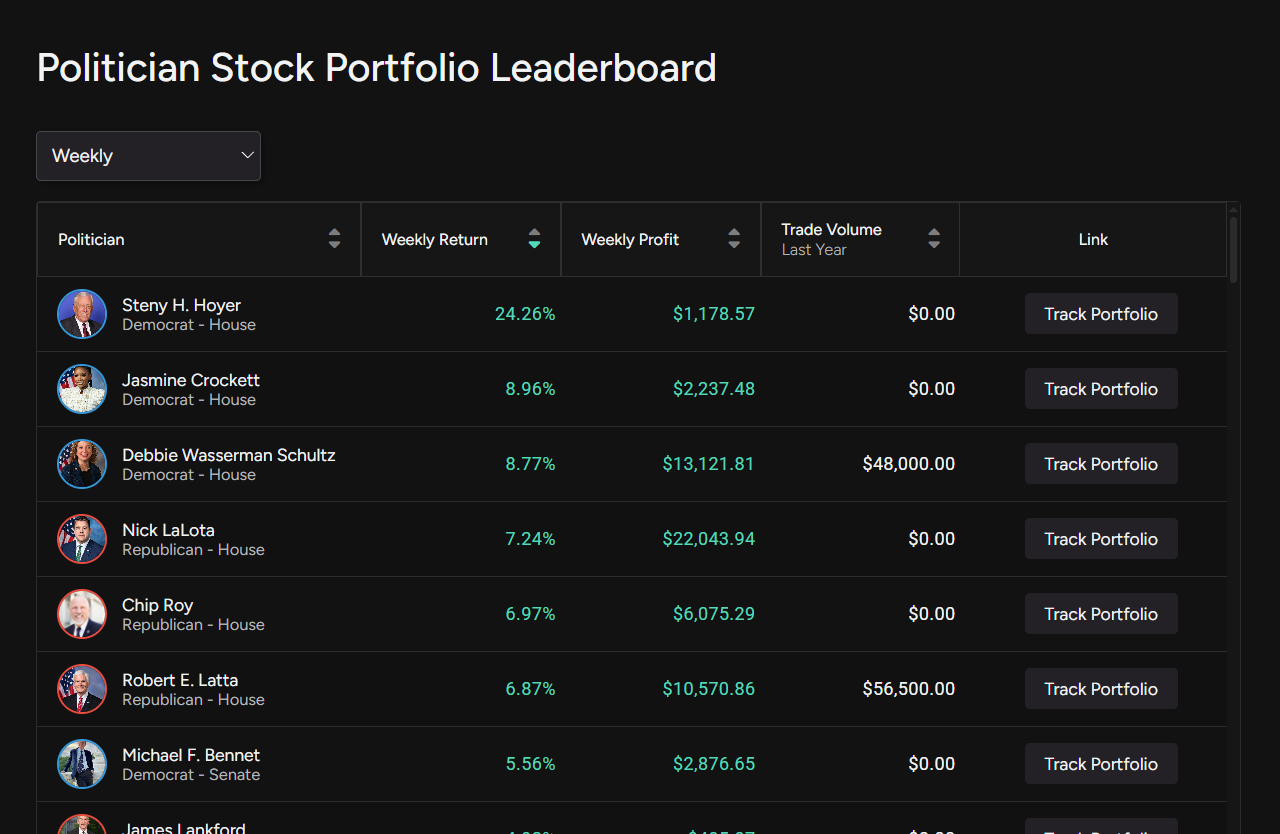 View Politician Stock Portfolio Leaderboard
Recent Trades - U.S. Congress
Click on a trade for more details
Estimated excess return of the underlying stock since the transaction
| Stock | Transaction | Politician | Filed | Traded | Description |
|---|
- 1M
- 3M
- 6M
- YTD
- 1Y
- 2Y
- 5Y
- MAX
About
Key Metrics
Return (1d)
Return (30d)
Return (1Y)
CAGR (Total)
Max Drawdown
Beta
Alpha
Sharpe Ratio
Win Rate
Average Win
Average Loss
Annual Volatility
Annual Std Dev
Information Ratio
Treynor Ratio
Total Trades
Metrics Definitions
Disclaimer: The performance results shown are based on historical backtesting and are hypothetical in nature. Backtested performance does not represent actual trading and does not account for all market factors that may affect execution, such as liquidity, slippage, and changing market conditions. Past performance is not necessarily indicative of future results. There is no guarantee that any trading strategy will be profitable or avoid losses.
-
Alpha
Measures a portfolio's risk-adjusted performance against that of its benchmark
Learn More about Alpha -
Annual Standard Deviation
Measures how much the portfolio's total return varies from its mean or average.
Learn More about Annual Standard Deviation -
Annual Volatility
A statistical measure of the dispersion of returns for the portfolio.
Learn More about Annual Volatility -
Average Win
The average return (%) for trades that resulted in a positive return.
-
Average Loss
The average return (%) for trades that resulted in a negative return.
-
Beta
A measure of the volatility of the portfolio compared to the market as a whole.
Learn More about Beta -
CAGR
CAGR (Compounded Annual Growth Rate), is the historical annualized rate of return for an investment strategy, throughout the backtest period.
Learn More about CAGR -
Information Ratio
A measurement of portfolio returns beyond the returns of its benchmark compared to the volatility of those returns.
Learn More about Information Ratio -
Max Drawdown
the maximum observed loss from a peak to a trough of a portfolio, before a new peak is attained.
Learn More about Max Drawdown -
Sharpe Ratio
The Sharpe Ratio is a measure of historical risk-adjusted return, which quantifies the amount of return that an investor received per unit of risk.
Learn More about Sharpe Ratio -
Total Trades
The total number of trades made by this strategy.
-
Treynor Ratio
Attempts to measure how successful an investment is in providing compensation to investors for taking on investment risk.
Learn More about Treynor Ratio -
Win Rate
The percentage of total trades that resulted in a positive return.
Sign up for Quiver Premium to see live holdings and portfolio insights for the Congress Long-Short Strategy
Most Active Congressional Traders - Last Year
Click on a politician for more details


Highest Net Worth Congressmembers
Click on a politician for more net worth details
|
|
Politician
|
Current Net Worth
|
|---|
Note that these are only rough estimates, and the data may be inaccurate or incomplete. This estimate does not include the value of the individual's primary residence, or any outstanding liabilities. Estimates of the value of publicly traded holdings are updated on an hourly basis. Estimates of the value of private holdings are only updated on an annual basis.
This data is parsed from congressional disclosures by Quiver Quantitative. Sign up for the Quiver Quantitative API for access to data on congressional stock transactions.