Quiver API Setup
You can use the Quiver API for easy, affordable access to data on congressional stock trading, insider transactions, hedge fund moves, election fundraising, corporate lobbying, and executive compensation. You can also use it to connect directly to Quiver’s newsfeed, and receive the most recent market-moving information.
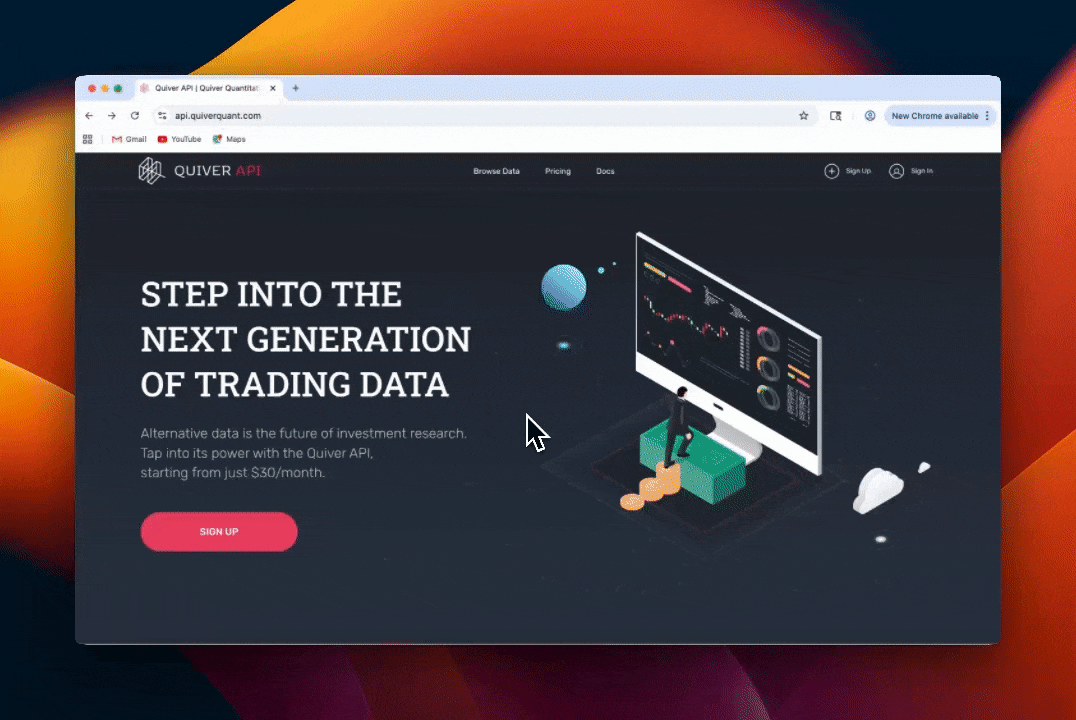
Step 1: Get your Quiver API key
Sign up on the Quiver API to see available plan options.
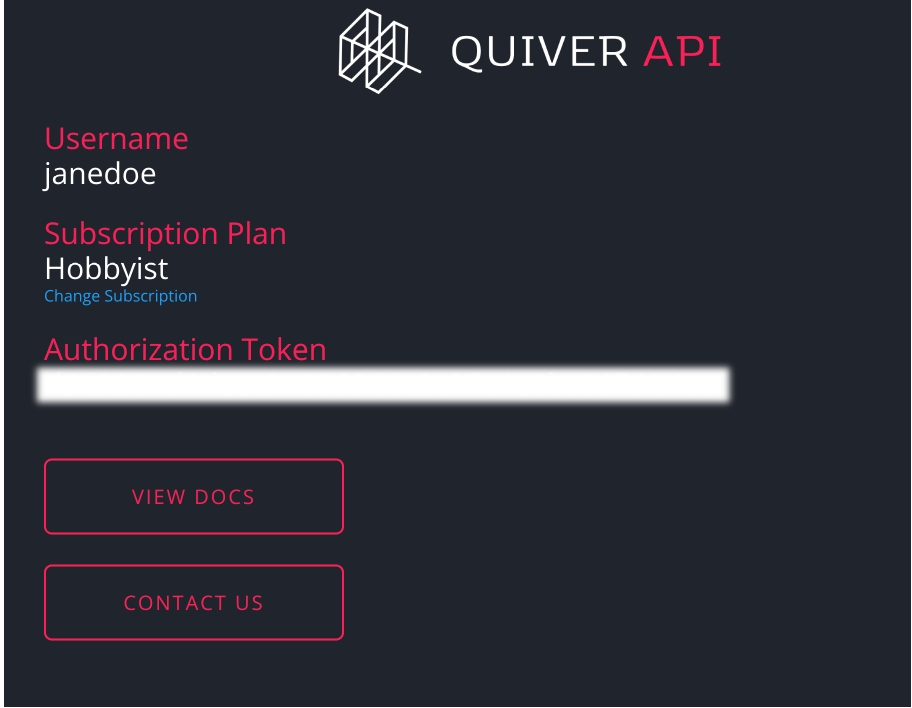
In this example, we are subscribed to the Hobbyist plan. After entering your payment information, save your API key (you'll need it to request the data later).
Step 2: Set up your Python Environment
Open your terminal and install the required libraries:
pip install requests pandasStep 3: Fetch Data
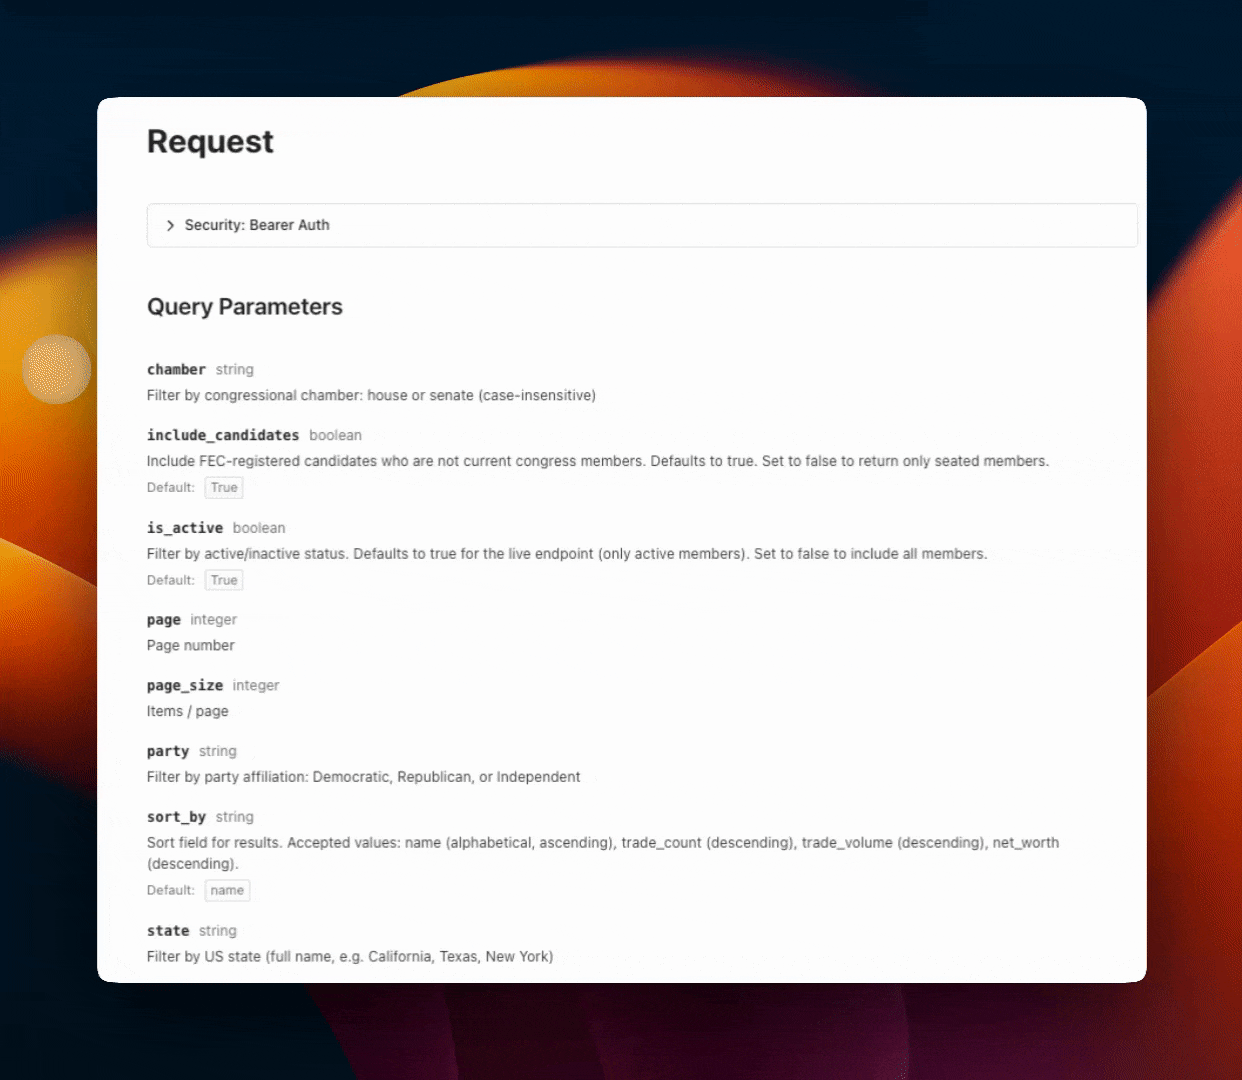
Head to the Quiver API Docs to see what datasets are available. You'll need a base URL (which stays consistent across all requests), an endpoint (which will trail after the base URL), and your API key (to validate your request).
Here is an example of how to create a request on the Congress Politicians Dataset:
import requests, pandas as pd
API_KEY = "YOUR_KEY_HERE"
response = requests.get(
"https://api.quiverquant.com/beta/bulk/congress/politicians",
headers={"Authorization": f"Bearer {API_KEY}"},
params={"chamber": "senate", "sort_by": "trade_count", "page_size": 10},
)
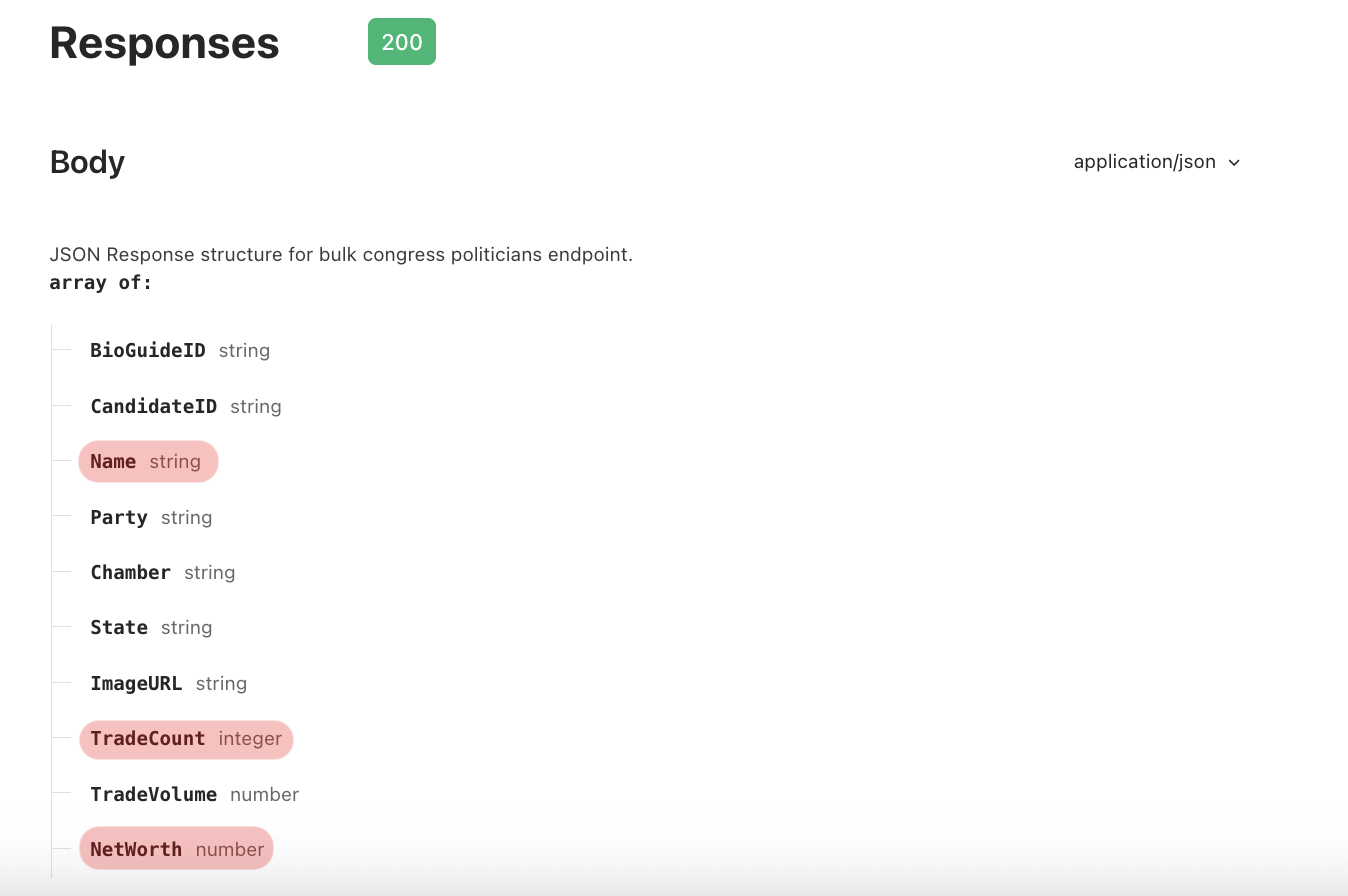
politicians = response.json()["data"]
df = pd.DataFrame(politicians)[["Name", "TradeCount", "Net Worth"]]
print("Top 10 most active traders in the Senate:\n")
print(df.to_string(index=False))In the API docs each endpoint’s page will contain one section called Request, and another section called Responses. The Request section provides a set of parameters that you can specify to make your results more meaningful to you.
In this example, I answered the question
“Who are the 10 most active traders in the Senate?” by setting the
When you receive a response from an API request, you can save that response in a variable.
In this case I named my variable
Next, I looked at the Responses section in the API docs to see what columns I would get back on a successful request. This allowed me to select the columns that I found interesting using a pandas DataFrame.
To run your script:
python congress_traders.pyStep 4: Build a Visualization
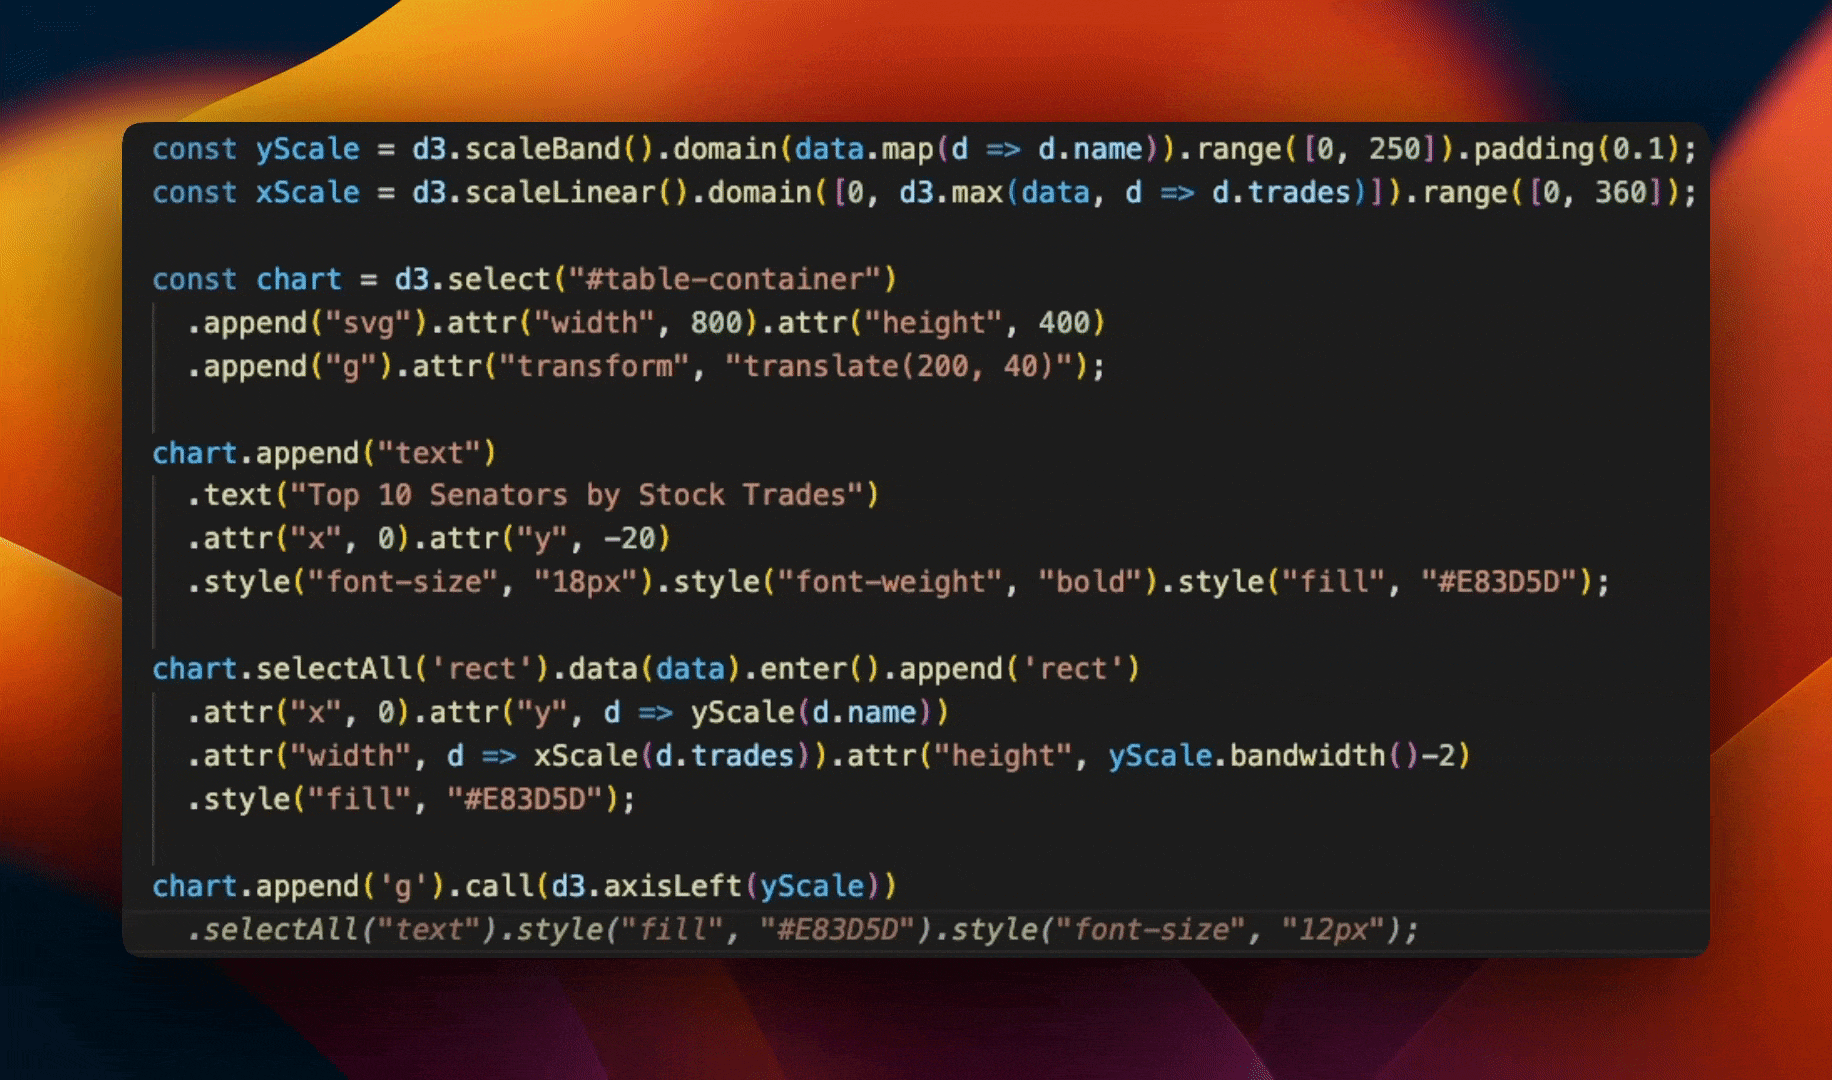
In the previous step we printed out the data. To make it look more interesting, you can create a visualization using a built-in python library like matplotlib or a javascript library like D3.js.
Here is an example using D3.js:
 Sign Up